Is the Hot Hand Real? The 1985 Study and Its 2018 Correction
Key Points
- A 1985 paper by Gilovich, Vallone and Tversky concluded that belief in the hot hand is a cognitive illusion; in its controlled experiment, Cornell players averaged .49 after three hits and .45 after three misses.
- Miller and Sanjurjo's November 2018 Econometrica paper shows that this kind of comparison is biased in short sequences: for a fair coin flipped three times, the expected proportion of heads after a heads is 5/12.
- After their correction the average difference in the reanalysis moved from +3 to +13 percentage points, and the authors conclude the hot hand is not a myth.
- A 2017 arXiv analysis of Warriors games, using a permutation test, concluded that Curry, Thompson and Durant were mostly not streak shooters, and its authors say the field is not close to consensus.
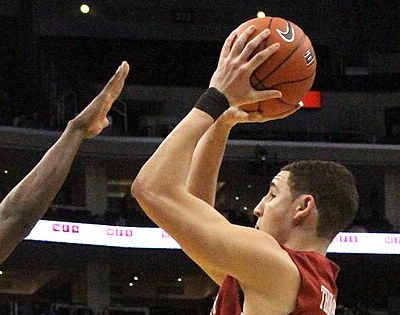

In a paper published in Econometrica in November 2018, Joshua Miller and Adam Sanjurjo argued that a common way of measuring streaks in sequential data is biased, and that after correcting for it the conclusion of the 1985 hot hand paper by Gilovich, Vallone and Tversky is reversed2. A 2017 paper posted to arXiv that built the correction into its method and analyzed Golden State Warriors games reached a conclusion close to the original one3. The sources below show what each reported and where the question stays open.
What the 1985 paper concluded
Miller and Sanjurjo describe the 1985 paper as finding no evidence of hot hand shooting in basketball data, despite a near-unanimous belief in it among players, coaches and fans, and quote its conclusion that the belief is a “powerful and widely shared cognitive illusion”1. Miller and Sanjurjo focus on its controlled experiment, which they describe as central to its conclusions. In it, 26 players from the Cornell University men's (14) and women's (12) basketball teams each shot 100 times from a distance at which the experimenters expected about 50 percent of shots to go in1.
One comparison, which Miller and Sanjurjo focus on, set each player's shooting percentage after three hits against the percentage after three misses. Across the players the averages were .49 after three hits and .45 after three misses, and a paired t test found the difference indistinguishable from zero (p = .49)1.
The coin flip bias
Miller and Sanjurjo open with a researcher who flips a fair coin three times and writes down the result of each flip that follows a heads. Of the eight possible sequences, six have at least one recorded flip, and the expected proportion of heads among the recorded flips is 5/12, not 1/21. The paper proves that for any finite sequence of three or more independent trials with the same success probability, the proportion of successes right after a streak of successes, among sequences with at least one such trial, is expected to be strictly less than the true probability of success; the bias generally shrinks as the sequence gets longer but grows with the length of the streak1. In one of its examples, with 100 trials, a success probability of 0.5 and a streak of five, the expected proportion is .35 rather than .501.
For a player who takes 100 shots and makes half of them, the paper puts the expected gap between the hit rate after three hits and the hit rate after three misses at about -8 percentage points for a consistent shooter, not zero. It says this leaves the difference the original authors observed 12 percentage points higher than that benchmark1.
What the correction found
After adjusting each player's difference for the bias, using the player's own shooting percentage, the paper reports that the average difference moves from +3 to +13 percentage points (p < .01, standard error 4.7 points). It reports that 19 of the 25 players with data showed the pattern in the direction of a hot hand and 5 were individually significant at p < .05, and that permutation tests, which it says are not affected by the bias, agree1.
The paper applies the same reasoning to two later studies. For a close replication with Olympic players taking 40 shots each, it derives a raw average difference of about -2 percentage points that becomes roughly +18 after correction. For the NBA three point contest, it reports on 28 years of contest data, 33 players with at least 100 shots, an average corrected difference of +8 percentage points (p < .01)1. On that basis the authors write that the hot hand is not a myth and that the belief in it is not a cognitive illusion, while allowing that it remains possible, perhaps even likely, that professional players and coaches sometimes see a hot hand where none exists1.
Game data gave a different answer
Alon Daks, Nishant Desai and Lisa Goldberg used a permutation test, which they say automatically accounts for the Miller and Sanjurjo correction, on field goal and free throw records from the Warriors' 2016 to 2017 regular season and postseason games3. Testing each game with a two-shot streak at the 5 percent level, they counted 2 significant games out of 96 for Stephen Curry, 4 out of 95 for Klay Thompson and 3 out of 77 for Kevin Durant3. They concluded that the three players were mostly not streak shooters in those games, which they describe as similar to the original conclusion3.
One example they give is Thompson's 60-point game on December 5, 2016, in which he made 31 of 44 shots; the test of whether his streaks were unusual returned a p-value of 0.843. They also write that the field is not close to consensus on the right way to think about the question3.
The abstract of a 2020 arXiv paper by Konstantinos Pelechrinis and Wayne Winston says its results in actual basketball game situations provide strong statistical evidence that the hot hand exists4. The abstract of an October 2020 arXiv paper by Brian McNair and coauthors says it finds no evidence of the hot hand in game play and only weak evidence in free throw trials5. Only the abstracts of those two papers were opened for this article.
What is and is not established
The sources support these statements. A simple comparison of hit rates after streaks is biased for short sequences, which is a mathematical result in a published Econometrica paper, and the Warriors analysis describes the correction as documenting an error in the original study. Correcting the 1985 controlled shooting data produced an average difference of +13 percentage points in the reanalysis, whose authors read it as evidence that the hot hand is real.
The sources do not settle how large any hot hand effect is in NBA games or whether it exists there. The controlled experiments and the game records use different data and methods, and the two 2020 abstracts point in opposite directions. The original 1985 paper was not opened, so its contents here come from the descriptions in the Miller and Sanjurjo and Daks papers.
Trivia
- How many Cornell basketball players took part in the controlled shooting experiment in the 1985 hot hand paper? 26 (14 men and 12 women)1.
- In Miller and Sanjurjo's three-flip coin example, what is the expected proportion of heads among the flips recorded after a heads? 5/121.
- In which journal and month did Miller and Sanjurjo's paper appear? Econometrica, November 20182.
- In the Miller and Sanjurjo reanalysis, the average difference in hit rates moved from +3 to what, in percentage points? +131.
- Which team's 2016 to 2017 games did Daks, Desai and Goldberg analyze? The Golden State Warriors3.
Sources
- Joshua B. Miller and Adam Sanjurjo, Surprised by the Hot Hand Fallacy? A Truth in the Law of Small Numbers, Econometrica, 86(6), 2018, pp. 2019 to 2047 (author copy on arXiv). Accessed November 18, 2026.
- Surprised by the Hot Hand Fallacy? A Truth in the Law of Small Numbers, Econometrica, November 2018, volume 86, issue 6 (publisher page). Accessed November 18, 2026.
- Alon Daks, Nishant Desai and Lisa R. Goldberg, Do the Golden State Warriors Have Hot Hands? (arXiv:1706.03442, v2, November 2017). Accessed November 18, 2026.
- Konstantinos Pelechrinis and Wayne Winston, The Hot Hand in Actual Game Situations (arXiv:2006.14609). Accessed November 18, 2026.
- Brian McNair, Eric Margolin, Michael Law and Ya'acov Ritov, The Hot Hand and Its Effect on the NBA (arXiv:2010.15943). Accessed November 18, 2026.