How to Read Why a Stock Moved: Earnings, Guidance, the Fed and CPI
Key Points
- Wells Fargo's stock dropped 3.1% after the bank reported weaker revenue for the latest quarter than analysts expected, even though its profit topped Wall Street's estimates.
- Goldman Sachs jumped more than 4% at the start of trading after a profit that blew past analysts' expectations, then erased the gain and closed slightly lower.
- On October 14, 2026, the 12-month CPI rate came in at 3.7%, worse than the 3.6% economists expected, and the 10-year Treasury yield briefly topped 5.32%.
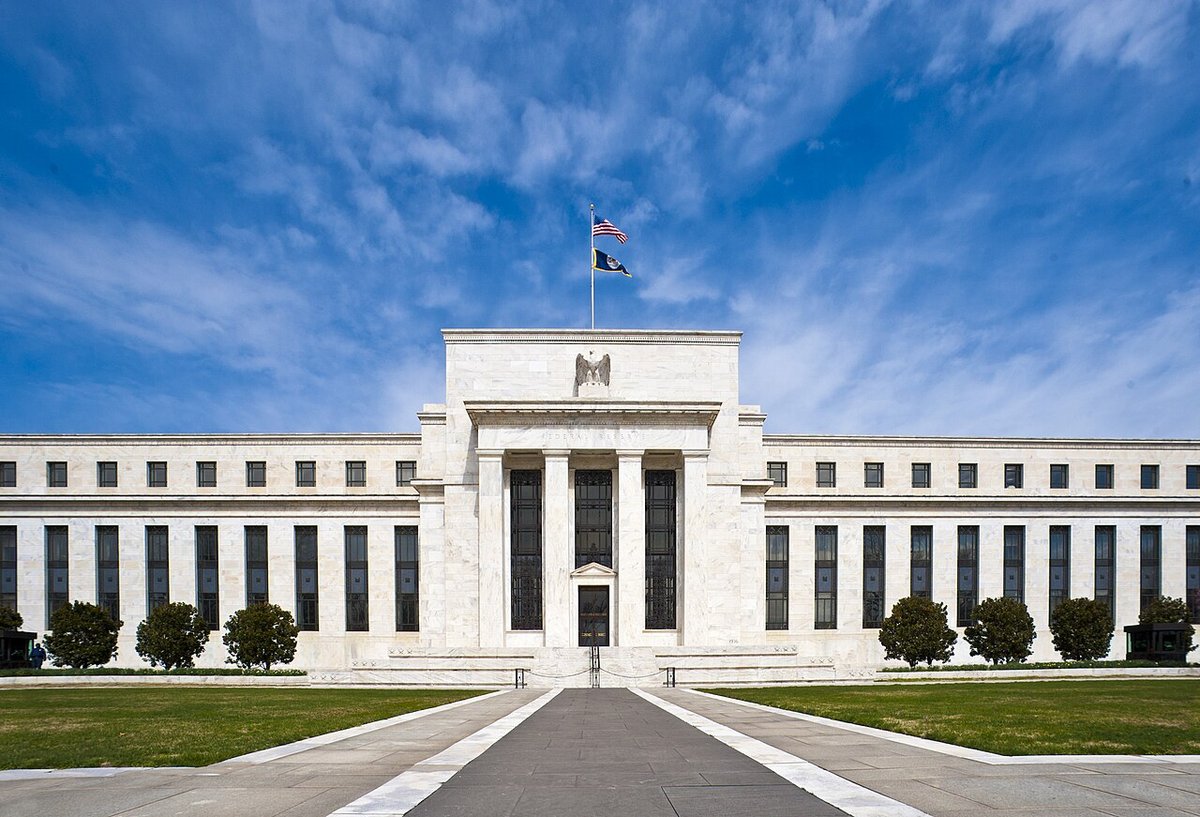

Every market headline comes with a reason attached: a stock jumped on earnings, slid on guidance, or fell with the market after an inflation report. This guide walks through the four explanations that come up most often, what each one actually measures, and how to tell which one was doing the work on a given day. The examples come from the week of October 12, 2026, which had all four at once.
The rule underneath all of it: surprise beats news
Investors price stocks with expectations already in mind. Going into this earnings season, the AP reported that analysts expected S&P 500 profits to grow nearly 30%3 from a year earlier, and that companies need to hit those high numbers to justify the record-setting runs for their stock prices3. The flip side, in the AP's October 14 story, is that companies will likely get punished if they fall short of targets for growth4. So the number that moves a stock is usually the gap between what was expected and what arrived, not whether the news sounds good.
1. Earnings: beats, misses and what got measured
Public companies report results every quarter. The formal quarterly report, Form 10-Q, is due 40 days after the end of the fiscal quarter2 for large accelerated and accelerated filers and 45 days after the end of the fiscal quarter for all other registrants2. Companies usually announce the numbers sooner, in an earnings press release. Goldman Sachs, for example, put out its third quarter 2026 earnings results15 on October 13, two weeks after the quarter ended. When a company makes that kind of announcement, SEC rules have it include the release as an exhibit to a Form 8-K, which is generally due within four business days after occurrence of the event1.
"Beat" and "miss" compare the results with what analysts forecast, usually summarized as a consensus from a data firm such as LSEG or FactSet3. Before Goldman Sachs reported on October 13, for example, CNBC listed what Wall Street expected for earnings per share, $13.02, according to LSEG6. Three things trip people up:
- Profit and revenue can point in different directions. Wells Fargo's stock dropped 3.1% after the bank reported weaker revenue for the latest quarter than analysts expected, even though its profit topped Wall Street's estimates3.
- A big beat can still fade. Goldman Sachs jumped more than 4% at the start of trading3 after a profit that blew past analysts' expectations3, then erased the gain and closed slightly lower. The opening move is a first reaction, and the close reflects a full day of investors reading the details.
- One-time items blur the comparison. Bank of America's October 14 release reported EPS of $0.91, including a regulatory settlement charge of $1.2 billion, or $0.17 per share16, and JPMorgan Chase gave its profit both with and excluding a significant item17. Read the release for items like these before deciding what the number says.
2. Guidance: the company's own forecast
Results describe the quarter that ended weeks ago. Guidance is a company's own forecast for what comes next. JPMorgan Chase showed the split on October 13: it reported a weaker profit for the latest quarter than analysts expected, but it also gave a forecast for net interest income in the current quarter that topped Wall Street's estimate3, and the stock spent the day flipping between gains and losses. A company can also move its own stock before it reports. Kimberly-Clark climbed 4.7% on October 15 after it said it expects to report revenue and profit for the latest quarter above what analysts had been expecting5.
When a stock moves on earnings day in the opposite direction from the beat or miss, guidance is one of the first places to look.
3. The Fed: why one rate moves every stock
The Federal Reserve's main tool is the federal funds rate, the rate that banks pay for overnight borrowing in the federal funds market8. Changes in it influence other interest rates that in turn influence borrowing costs for households and businesses8. The rate is set by the Federal Open Market Committee, which holds eight regularly scheduled meetings per year10.
Stocks feel this through bond yields. The Fed's own guide to monetary policy says it directly affects interest rates; it indirectly affects stock prices11, and that changes in longer-term interest rates usually also affect stock prices11. The same guide describes the mechanism from the other side: if longer-term interest rates decline, then investors may decide to purchase stocks, thus bidding up stock prices11. The AP put the pressure in market terms, higher yields in the bond market push downward on prices for all kinds of stocks4.
Expectations matter here too. Longer-term rates are also affected by how people expect the federal funds rate to change in the future11, so a stock can fall on a day the Fed does nothing, because something changed the odds of what the Fed does next. Traders track those odds with futures prices, reported as probabilities. Shortly after the September inflation report came out, CNBC reported that the odds of a hike at the next meeting rose to about 54%, according to the CME Group's FedWatch tool7. Market stories quote these numbers often; they are traders' bets, not Fed decisions.
4. CPI: the inflation report that moves rate bets
The consumer price index is a measure of the average change over time in the prices paid by urban consumers for a market basket of consumer goods and services12, published monthly by the Bureau of Labor Statistics. Two numbers get the attention: the change from the prior month and the change over 12 months. A third, core inflation, leaves out food and energy, which the BLS release reports as the index for all items less food and energy13. CNBC's report on the September figures describes core as stripping out volatile food and energy costs7.
CPI moves stocks through the Fed channel above, and October 14, 2026 showed each step: the 12-month rate came in at 3.7%, worse than the 3.6% that economists expected4, the 10-year Treasury yield briefly topped 5.32% (from less than 5.17% just before the report4), and AI stocks led the S&P 500 lower because higher borrowing costs could make it more difficult for companies to raise cash to build data centers4.
CPI is not the Fed's own target measure. The Fed's 2 percent goal is measured by the annual change in the price index for personal consumption expenditures9. Markets still trade on CPI, as October 14 showed.
A five question checklist
- What happened, and when? Match the move to the clock. The BLS releases CPI at 8:30 A.M. Eastern Time12, so a jump in futures and yields at that minute on a CPI day lines up with the report.
- What was expected? Find the consensus figure. A strong number that missed a stronger forecast still reads as a miss.
- Which line moved the stock? Profit, revenue and guidance can disagree, as Wells Fargo and JPMorgan showed.
- Did yields or rate odds move? If the whole market fell with bond yields rising, the story is probably rates, not the company.
- Did the whole group move? When Micron fell on October 13, the AP tied it to reports that China's memory chipmaker CXMT is making advances3, news about an industry rather than one company's quarter.
None of this predicts the next move. It explains the last one, which is the part of market news that can actually be checked.
Trivia
How many members sit on the Federal Open Market Committee?
Twelve: the seven members of the Board of Governors, the president of the Federal Reserve Bank of New York, and four of the remaining eleven Reserve Bank presidents10, who rotate.
How many regional Reserve Banks did the final Federal Reserve Act allow for?
Between eight and twelve18, a range worked out in committee.
Which president signed the Federal Reserve Act, and when?
Woodrow Wilson, on December 23, 191318.
On which Georgia island did a then-secret 1910 meeting of bankers help start the plan for a US central bank?
Jekyll Island18. To keep it secret, the people who attended told others they were on a duck hunting trip.
In 1919, the BLS began publishing consumer price indexes for how many cities?
3214. A national index followed in 192114.
Which Form 8-K item covers a company announcing its quarterly results?
Item 2.02, Results of Operations and Financial Condition1.
Market Watch reports what happened and what was reported about it. It is not investment advice, and nothing here is a recommendation to buy, sell or hold any security.
Sources
- U.S. Securities and Exchange Commission, Form 8-K, General Instructions. Accessed October 15, 2026.
- U.S. Securities and Exchange Commission, Form 10-Q, General Instructions. Accessed October 15, 2026.
- Stan Choe, Associated Press, U.S. stocks edge back from their record following the first big batch of profit reports for the summer, via BNN Bloomberg, October 13, 2026. Accessed October 15, 2026.
- Stan Choe, Associated Press, US stocks drop to their worst day since July as inflation worsens, via OPB, October 14, 2026. Accessed October 15, 2026.
- Associated Press, Wall Street muscles higher despite more swings for AI stocks, via ClickOnDetroit, October 15, 2026. Accessed October 15, 2026.
- Hugh Son and others, Bank earnings takeaways: Here's how JPMorgan, Goldman, Wells Fargo and Citi performed in Q3, CNBC, October 13, 2026. Accessed October 15, 2026.
- Jeff Cox, Consumer prices rose 3.7% annually in September as gas prices skyrocket, CNBC, October 14, 2026. Accessed October 15, 2026.
- Board of Governors of the Federal Reserve System, How does the Federal Reserve affect inflation and employment?. Accessed October 15, 2026.
- Board of Governors of the Federal Reserve System, What economic goals does the Federal Reserve seek to achieve through its monetary policy?. Accessed October 15, 2026.
- Board of Governors of the Federal Reserve System, Federal Open Market Committee. Accessed October 15, 2026.
- Board of Governors of the Federal Reserve System, Purposes and Functions of the Federal Reserve System, section 3: Conducting Monetary Policy. Accessed October 15, 2026.
- U.S. Bureau of Labor Statistics, Consumer Price Index home page. Accessed October 15, 2026.
- U.S. Bureau of Labor Statistics, Consumer Price Index, September 2026, news release USDL-26-1574, October 14, 2026. Accessed October 15, 2026.
- U.S. Bureau of Labor Statistics, Handbook of Methods, Consumer Price Index: History. Accessed October 15, 2026.
- The Goldman Sachs Group, Third Quarter 2026 Earnings Results, exhibit 99.1, October 13, 2026. Accessed October 15, 2026.
- Bank of America, Third Quarter 2026 earnings press release, exhibit 99.1, October 14, 2026. Accessed October 15, 2026.
- JPMorgan Chase and Co., Third-Quarter 2026 earnings release, exhibit 99.1, October 13, 2026. Accessed October 15, 2026.
- Federal Reserve Act Signed into Law, Federal Reserve History. Accessed October 15, 2026.