Builder Confidence Fell Four Points to 25 in November, NAHB Says
Key Points
- NAHB and Wells Fargo report the Housing Market Index fell four points to 25 in November 2026.
- Current sales conditions fell six points to 28, expectations dropped two points to 30 and buyer traffic fell two points to 16.
- NAHB reports that 46 percent of builders cut prices in November, the highest share in the post-Covid period, with the average cut at 6 percent.
- NAHB's history table lists 24 for April 2012 as the last month below November's 25.
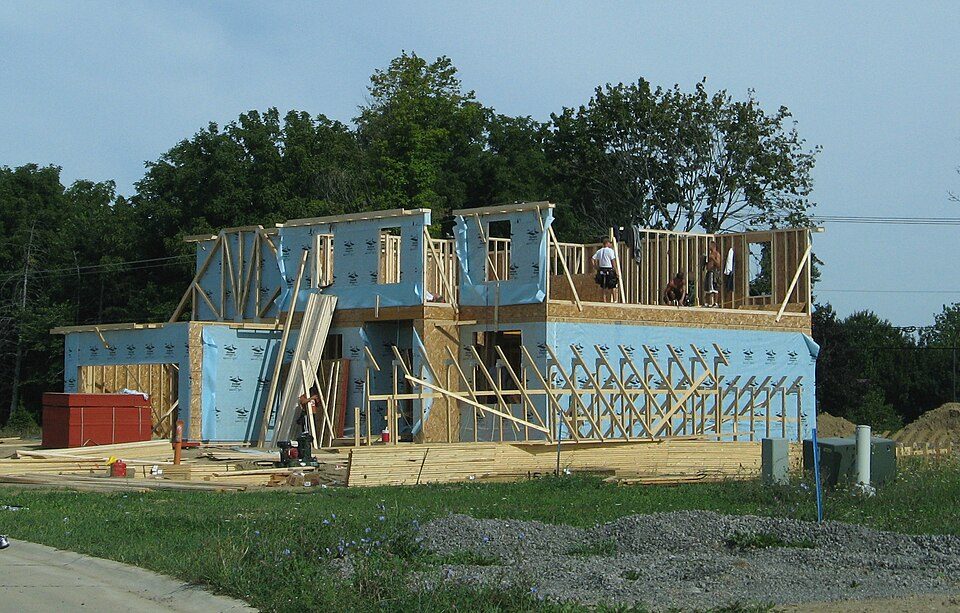

The National Association of Home Builders and Wells Fargo report that builder confidence in the market for newly built single-family homes fell four points to 25 in November 20261. NAHB's history table shows the index at 29 in October and 32 in September, so November is the third monthly decline in a row3. This article walks through what the index measures, how the three parts moved and what NAHB says about price cuts.
What the index measures
NAHB says the Housing Market Index is a weighted average of three parts of its monthly builder survey, which are present sales of new single-family homes, expected sales for the next six months and traffic of prospective buyers1. The weights are 0.5920 for present sales, 0.1358 for expected sales and 0.2722 for buyer traffic1.
Builders rate the first two as good, fair or poor, and rate traffic as high to very high, average or low to very low. Each component index is (good minus poor plus 100) divided by 2, so it is 50 when the share saying good equals the share saying poor1. A shift of one percentage point from poor to good raises an index by one point, and a shift from fair to good raises it by half a point1.
The three parts
Current sales conditions fell six points to 28, sales expectations for the next six months dropped two points to 30, and traffic of prospective buyers fell two points to 161. Table 1 lists the same three readings for November, with the October figures just before them at 34, 32 and 182.
Because present sales carries the largest weight, it accounts for most of the headline move. As a check on the published weights, 28 times 0.5920, plus 30 times 0.1358, plus 16 times 0.2722, comes to 25.0, which matches the headline index. That is arithmetic on NAHB's published figures and not a separate NAHB statement.
By region
Table 1 lists regional readings of 31 in the Northeast, 30 in the Midwest, 23 in the South and 19 in the West for November2. The same table gives three month moving averages of 34 for the Northeast, 35 for the Midwest, 27 for the South and 23 for the West2. Both sets of figures are seasonally adjusted, as the table headers state.
Price cuts and incentives
NAHB reports that 46 percent of builders reduced prices in November, the highest share in the post-Covid period, and that the average price reduction held at 6 percent for an eighth straight month1. It also reports that 68 percent of builders offered sales incentives, also a post-Covid high, and that this was the 20th consecutive month in which at least 60 percent of builders used them1.
How the reading compares with history
The history table, which starts in 1985, lists 25 for November 2026 and 24 for April 20123. Reading down that table, no month between those two dates is at or below 25 (the reading tied at 25 in January 2012). The table's 2026 row runs 37, 37, 38, 34, 37, 36, 34, 35, 32, 29 and 25 from January through November. These are the survey's published figures, with no forecast attached and no advice.
Trivia
- What did the NAHB/Wells Fargo Housing Market Index read in November 2026? 25, down four points.1
- Which of the three components has the largest weight in the index? Present sales of new single-family homes, at 0.5920.1
- What share of builders reduced prices in November 2026? 46 percent, the highest in the post-Covid period.1
- What reading does the index show when the share of builders saying good equals the share saying poor? 50.1
- Which region had the lowest November 2026 reading in Table 1? The West, at 19.2
Sources
- NAHB/Wells Fargo Housing Market Index (HMI), HMI Key Findings: November 2026, National Association of Home Builders. Accessed November 18, 2026.
- Table 1. NAHB/Wells Fargo National and Regional Housing Market Index (HMI), November 2026, National Association of Home Builders. Accessed November 18, 2026.
- Table 2. NAHB/Wells Fargo National HMI History, November 2026, National Association of Home Builders. Accessed November 18, 2026.