Australian Grid Sets a Renewables Record of 80.4% in One Half Hour
Key Points
- In the half hour ending at 12:30 on 19 September 2026, renewables and storage supplied "80.4% of total NEM generation", AEMO reports.
- Across July to September, renewables supplied "a record Q3 share of 44.3% of NEM generation", up from 41.8% a year earlier.
- Big batteries supplied 8.0% of evening peak generation, more than gas at 5.1%, "for the first time in any quarter".
- Wholesale spot prices averaged A$63 per megawatt hour, down 27%, "the lowest Q3 average since 2021".
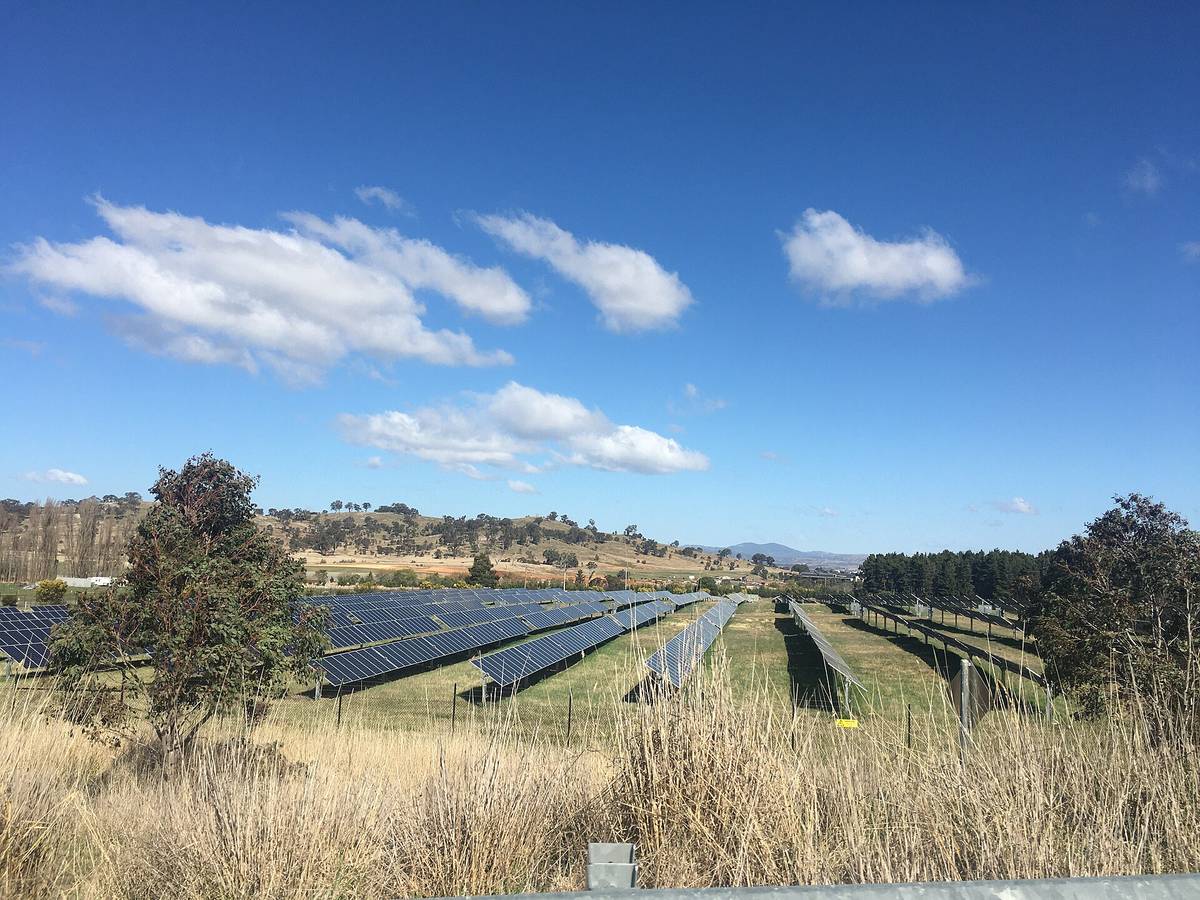

For one half hour on a Saturday in September, eastern Australia's main grid ran mostly on sun, wind and water. In the half hour ending at 12:30 on 19 September 2026, renewable generation and storage supplied an all-time high of 80.4% of total generation1 in the National Electricity Market, according to the Australian Energy Market Operator (AEMO), and it stood as the record when AEMO published its report. The figure comes from AEMO's Quarterly Energy Dynamics report for July to September 2026, which pv magazine covered on 23 October2.
The new mark beat the previous record, set in October 2025, by 1.8 percentage points1, and it was 3.2 points higher than the peak in the same quarter a year earlier. AEMO's NEM fact sheet lists that earlier record, as an instantaneous renewable contribution, at 78.63% on 11 October 20253.
What the NEM is
The National Electricity Market is the connected grid and wholesale market of eastern and southern Australia. AEMO's report lists its regions as Queensland, New South Wales, the Australian Capital Territory, Victoria, South Australia and Tasmania1. Western Australia sits outside it and runs its own Wholesale Electricity Market, which AEMO reports on separately. The NEM commenced as a wholesale electricity market in December 19983.
What the 80.4% measures
AEMO's report introduces the measure as the renewable and storage contribution to demand, but a footnote defines the number itself. The peak figure is calculated as a share of total generation1, half hour by half hour, because half-hourly is the finest detail available for estimated rooftop solar output. Total generation means large-scale generation plus AEMO's estimate of what rooftop panels produced.
On the renewable side of the ledger, AEMO counts grid-scale wind and solar, hydro generation (including pumped hydro), biomass, battery discharge and distributed PV1. Distributed PV is the industry's term for small solar systems, mostly rooftop panels on homes and businesses. Because batteries and pumped hydro are in the count, some of the energy in the 80.4% was stored earlier and released at that moment.
Rooftop solar did most of the work at the record. At the time of the peak, distributed PV provided 51.8% of total generation1, with grid-scale solar at 16.4% and wind at 11.2%.
The quarter as a whole
One half hour is not a typical day. Across the whole quarter, renewables supplied a record Q3 share of 44.3% of NEM generation1, up from 41.8% in the third quarter of 2025. That quarterly share is measured a different way. It excludes grid-scale battery discharge and pumped hydro production1 from both sides of the sum, so stored energy is not counted twice.
Solar farms and hydro drove the rise. Grid-scale solar output grew by 512 MW (+30%) to a new Q3 high of 2,211 MW1, mostly from new projects connecting and others working through commissioning, and hydro rose 15% to 1,572 MW. Wind went the other way, falling 6.0% to 4,395 MW, which AEMO puts down to lower wind speeds across most regions.
Rooftop solar kept growing too. Distributed PV reached a record Q3 average of 3,203 MW1, up 13% on a year earlier. Installed rooftop capacity across the NEM rose from 24 gigawatts (GW) at the end of Q3 2025 to 27 GW1, and the number of systems climbed from 3.7 million to 3.9 million. NEM-wide minimum operational demand fell to a new all-time low of 9,422 MW on Sunday 20 September1.
Batteries move the sunshine into the evening
The clearest change from a year earlier is in batteries. Grid-scale batteries charged 13.4 gigawatt hours (GWh) of energy per day on average during daylight hours1 and discharged 10.9 GWh during the evening peak, from 4pm to 9pm. In the same quarter of 2025 those figures were 3.7 GWh and 3.2 GWh. During the evening peak, batteries supplied 8.0% of total generation, exceeding the contribution from gas-fired generation (5.1%) for the first time in any quarter1.
AEMO's sample data suggests households with rooftop solar and batteries drew around three quarters less power from the grid during the evening peak1 than households with solar alone. Household batteries installed in the NEM under the federal Cheaper Home Batteries Program added up to 13,917 MWh1 of capacity by the end of September.
Battery charging also means less solar goes to waste. Solar farms often cut output on purpose when prices are low, which AEMO calls economic offloading. For grid-scale solar that fell by more than half, to 149 MW (-54%)1, or from 15.7% to 5.9% of available solar output. Not every constraint eased, though. Curtailment of grid-scale solar rose by 105 MW, to average 169 MW, largely related to network limitations in southern New South Wales and northern Queensland1, where network constraints held output below what the panels could produce.
Prices, negative prices and coal
Wholesale spot prices across the NEM averaged $63/MWh, down $23/MWh (-27%) from Q3 20251, in Australian dollars. At the Reserve Bank of Australia's rate of 0.7034 US dollars per Australian dollar on 28 October 20264, that is about US$44 per megawatt hour, and the A$23 drop is about US$16. AEMO calls it the lowest third-quarter average since 2021 and links it to lower evening demand, more battery activity and less price volatility. Batteries charging or discharging set prices in almost half (48%) of dispatch intervals1, up from 18% a year earlier.
Negative prices became less common. Negative or zero prices occurred in 14.4% of dispatch intervals across the NEM, down 4.5 percentage points1 from a year earlier, with every mainland region lower. Tasmania was the exception, rising 9.2 points to 13% of intervals.
Coal still supplied more than half of the quarter's generation. Coal-fired generation increased by 22 MW year-on-year to average 13,515 MW1, as black coal fell 2.9% and brown coal rose 8.9%, leaving them with shares of 37.4% and 14.8% of generation. Gas-fired generation averaged 881 MW, the lowest Q3 average recorded since 20001. With brown coal up, total NEM emissions of 28.0 million tonnes of carbon dioxide equivalent1 were broadly unchanged on a year earlier.
Why it matters
Underlying demand reached a new Q3 high of 25,471 megawatts1, with Victoria accounting for almost all of the growth through electrification, industry and data centres. Even so, growth in distributed PV output slightly exceeding the underlying demand increase1 meant operational demand, what the grid itself supplies, fell slightly to an average of 22,268 MW. The record half hour shows how far sun and wind can carry the system on a mild, sunny weekend. The battery numbers point at the harder part, which is moving that midday energy into the evening. Violette Mouchaileh, an AEMO executive general manager, said that "more solar and storage is changing when energy is produced", as quoted by pv magazine2.
Trivia
- What is the NEM's maximum demand record, according to AEMO's fact sheet? 35,796 MW, on 29 January 20093, according to AEMO's fact sheet.
- How often does the NEM spot market schedule its generators? Every five minutes. Output from all generators is aggregated and scheduled at five-minute intervals3 to meet demand.
- Roughly how much transmission line does the NEM cover? Around 40,000 km of transmission lines and cables3, about 24,900 miles.
- Besides Western Australia, which part of Australia is not connected to the NEM? The Northern Territory. AEMO notes that Western Australia and the Northern Territory are not connected to the NEM3.
- Who are AEMO's members? It is a not-for-profit company whose membership is currently state and federal governments (60%) and energy industry members (40%)3.
- Which NEM region set its own renewable and storage record in the September 2026 quarter? Queensland, which reached a record high contribution of 75.2%1 in the half hour ending at 11:00 on Monday 21 September 2026.
- What did the NEM's maximum renewable and storage potential reach on 20 September 2026? 115%1, in the half hour ending at 13:00, a record for the renewable and storage output that could have been available at that moment.
Sources
- Quarterly Energy Dynamics Q3 2026, Australian Energy Market Operator (AEMO), October 2026. Accessed October 29, 2026.
- Ev Foley, Australian solar drives renewables to record 80.4% share of NEM generation, pv magazine, 23 October 2026. Accessed October 29, 2026.
- Fact sheet: National Electricity Market, Australian Energy Market Operator (AEMO), 2025, hosted by Hydro Tasmania. Accessed October 29, 2026.
- Exchange Rates, Reserve Bank of Australia. Accessed October 29, 2026.