Black Monday 1987: How the Dow Lost 22.6 Percent in One Day
Key Points
- On Black Monday, October 19, 1987, the Dow Jones Industrial Average finished down 508 points, or 22.6 percent, on volume of 604 million shares.
- Much of the blame went to portfolio insurance, and the presidential task force cited estimates that $60 to $90 billion of equity assets were under it when the break hit.
- As of October 2026, market-wide circuit breakers are set at declines of 7, 13 and 20 percent in the S&P 500.
- By the Fed history essay's count, the Dow gained back 288 points, or 57 percent, of the Black Monday loss in two trading sessions.
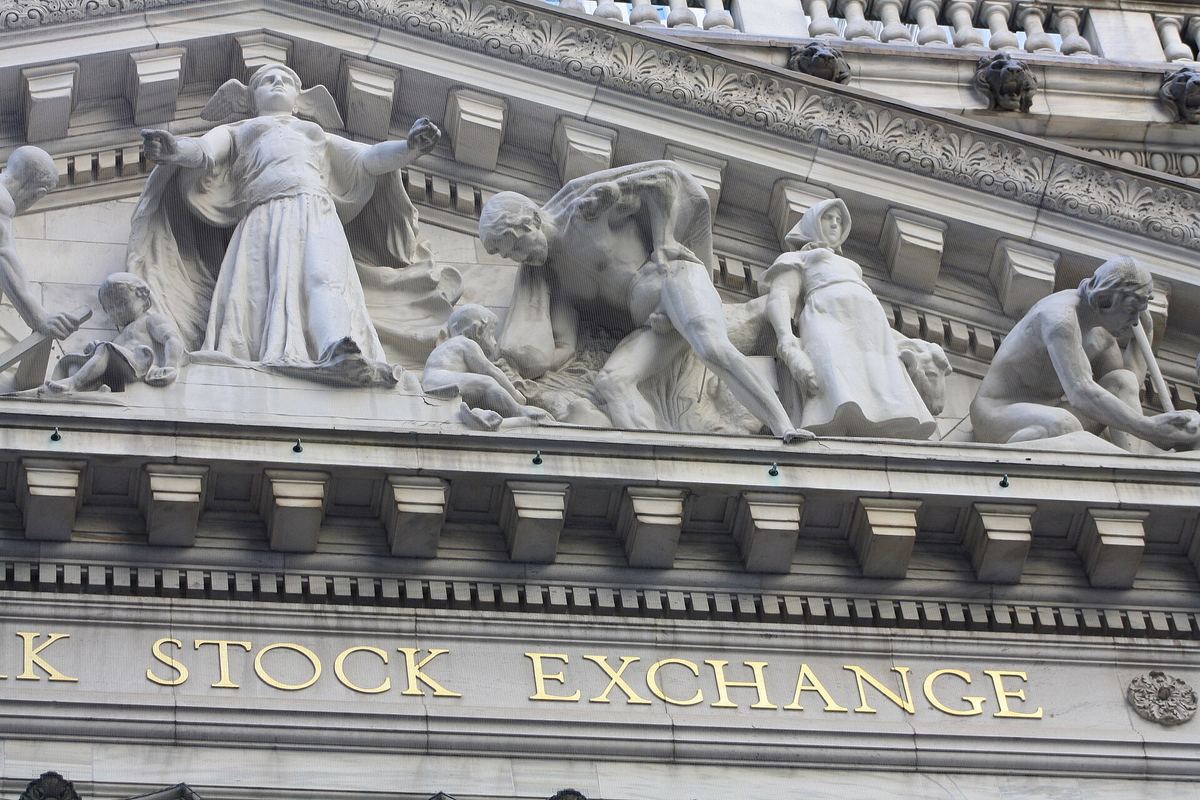

On Monday, October 19, 1987, the Dow Jones Industrial Average finished down 508 points, or 22.6 percent1, a percentage loss the Federal Reserve's history site calls the largest one-day stock market decline in history1. The 39th anniversary, October 19, 2026, falls on a Monday too.
A presidential task force found the Dow closed at 1,7382 on volume of 604 million shares worth just under $21 billion2. Counting from the close on Tuesday, October 13, the Dow declined by almost one third2 in four trading days, a loss in the value of all outstanding US stocks of approximately $1.0 trillion2.
A long run up, then a bad week
Stocks had been climbing for years. The Dow rose from 777 to 1,896 between August 1982 and December 19862, and by late August 1987 it had gained 44 percent in a matter of seven months1. When it peaked at 2,722 that August, the task force wrote, stocks were valued at levels which challenged historical precedent and fundamental justification2. Meanwhile, a Fed staff history notes, interest rates were rising globally3, while a growing trade deficit and a falling dollar fed worries about inflation and higher US rates.
The slide started on Wednesday, October 14. That morning the Commerce Department's figure for the August trade deficit came in notably above expectations3, and news reports said a House committee had filed legislation to eliminate tax benefits associated with financing mergers3, which hit the shares of likely takeover targets. The Dow lost 4.6 percent1 on Friday, October 16 alone, and the S&P 500 ended the week down over nine percent3.
Monday, around the world
The crash did not start in New York. Even before US markets opened for trading on Monday morning, stock markets in and around Asia began plunging1. The Fed history essay calls the episode the first contemporary global financial crisis1.
In the US, there was substantial selling pressure on the NYSE at the open3, with far more sell orders than buy orders, and the worst came late in the session. The Dow sank almost 300 points in the last hour and one quarter of stock trading2. On the New York Stock Exchange, trade executions were reported more than an hour late3, so investors could not tell whether their orders had gone through. Intel chief executive Andrew Grove summed up the mood in an interview the essay quotes: "It's a little like a theater where someone yells 'Fire!'"1
Why it fell so fast
Much of the blame went to a strategy called portfolio insurance. Under it, computer models were used to compute optimal stock-to-cash ratios at various market prices3, telling the investor to cut back on stocks as the market fell. Many portfolio insurers conducted their operations in the futures market rather than in the cash market3. The task force cited estimates that $60 to $90 billion of equity assets were under portfolio insurance administration2 when the break hit.
By Monday morning the insurers were behind. With the market already down about 10 percent, their models said at least $12 billion2 of stock should have been sold, and less than $4 billion had in fact been sold2. On October 19, sell programs by three portfolio insurers came to just under $2 billion in the stock market2, plus the equivalent of $2.8 billion of stock2 in futures. A related program trading strategy, index arbitrage, tries to profit from price differences in futures and stocks2, and the task force found that selling pressure in the futures market was transmitted to the stock market by the mechanism of index arbitrage2.
The deeper problem, in the task force's phrase, was an illusion of liquidity2. Markets that could absorb ordinary selling could not cope once everyone showed up on the same side of the market at once2.
The Fed's one sentence
The Federal Reserve answered before trading opened on Tuesday, October 20, with a short statement3 from Chairman Alan Greenspan: "The Federal Reserve, consistent with its responsibilities as the Nation's central bank, affirmed today its readiness to serve as a source of liquidity to support the economic and financial system."1
Action followed behind the scenes. The Fed encouraged banks to continue to lend on their usual terms1, and the 10 largest New York banks nearly doubled their lending to securities firms1 that week. The essay notes that Black Monday was not followed by an economic recession or a banking crisis1, though some argue the rescue set a precedent that could exacerbate moral hazard1.
What changed after
The presidential task force, chaired by Nicholas F. Brady, delivered its report in January 1988. Its key conclusion was that stocks, stock index futures and stock options are in fact one market2, even though they had traditionally been seen as separate markets. It made five recommendations:
- One agency should coordinate2 the few regulatory issues that cut across those markets.
- Clearing systems should be unified2 across marketplaces.
- Margins should be made consistent2 across marketplaces.
- Circuit breaker mechanisms (such as price limits and coordinated trading halts)2 should be put in place.
- Information systems should be established2 to monitor related markets.
The NYSE had no circuit breakers in place in October 19874. A year later, in October 1988, it adopted Rule 80B, with a one-hour halt after a 250-point decline in the DJIA and a two-hour halt after a 400-point decline4. Regulators also overhauled trade-clearing protocols1 to bring uniformity to all prominent market products.
The trigger today is a percentage of the S&P 500, not a count of Dow points. As of October 2026, the SEC's investor site describes three market-wide thresholds, 7% (Level 1), 13% (Level 2), and 20% (Level 3)5, set each day from the prior close. A Level 1 or Level 2 drop before 3:25 p.m. will halt market-wide trading for 15 minutes5, while the same drop at or after 3:25 p.m. does not stop trading. A Level 3 drop at any hour will halt market-wide trading for the remainder of the trading day5. The exchanges and FINRA adopted uniform rules on a pilot basis6 for this system in 2012.
How fast the market came back
The rebound began almost at once. By the Fed essay's count, in just two trading sessions, the DJIA gained back 288 points, or 57 percent, of the total Black Monday downturn1. The full recovery took longer, and the essay says that less than two years later, US stock markets surpassed their pre-crash highs1.
Trivia
What expiration event does the Fed history essay tie to Friday, October 16, 1987?
What it calls "triple witching," the day when monthly expirations of options and futures contracts occurred on the same day1.
What did Treasury Secretary James Baker do on Saturday, October 17, 1987?
According to the Fed history essay, he publicly threatened to de-value the US dollar1 to narrow the widening trade deficit.
How many S&P 500 stocks still had not opened for trading by 10 a.m. on Black Monday?
Ninety-five. The SEC found that by 10:00, 95 S&P stocks, representing 30% of the index value, were still not open3.
How did S&P 500 futures fare on Black Monday?
Worse than the stocks. They had fallen 29 percent on total volume of 162,000 contracts2, valued at almost $20 billion.
How many days did the presidential task force's mandate give it to explain the crash?
Sixty. President Reagan created it by an Executive Order dated November 5, 19872, and its mandate was, in 60 days, to determine what happened and why2.
When did the NYSE circuit breaker first stop trading?
On October 27, 19977, when the Dow dropped 554 points. Trading halted for half an hour at 2:36 p.m., and a second halt at 3:30 p.m. ended up closing the markets for the day7.
How many times did the market-wide circuit breaker trip in March 2020?
Four, all Level 1 halts, on March 9, 12, 16, and 18, 20206. Each time trading stopped at a 7 percent drop and resumed 15 minutes later.
Sources
- Donald Bernhardt and Marshall Eckblad, Stock Market Crash of 1987, Federal Reserve History, written as of November 22, 2013. Accessed October 18, 2026.
- Presidential Task Force on Market Mechanisms (Nicholas F. Brady, chairman), Report of the Presidential Task Force on Market Mechanisms, U.S. Government Printing Office, January 1988 (scanned copy hosted by the New Economic School). Accessed October 18, 2026.
- Mark Carlson, A Brief History of the 1987 Stock Market Crash with a Discussion of the Federal Reserve Response, Finance and Economics Discussion Series 2007-13, Federal Reserve Board, November 2006. Accessed October 18, 2026.
- Lisa Ashley, Circuit Breakers: Back to the Basics, Chicago Fed Letter No. 131, Federal Reserve Bank of Chicago, July 1998. Accessed October 18, 2026.
- U.S. Securities and Exchange Commission, Office of Investor Education and Advocacy, Stock Market Circuit Breakers, Investor.gov. Accessed October 18, 2026.
- Securities and Exchange Commission, Notice of Filing and Immediate Effectiveness of a Proposed Rule Change To Extend the Pilot Related to the Market-Wide Circuit Breaker in Rule 11.18 to April 18, 2022 (Cboe BZX Exchange), Release No. 34-94464, Federal Register Vol. 87, No. 57, March 24, 2022. Accessed October 18, 2026.
- James L. Cochrane, New York Stock Exchange, prepared testimony, Oversight Hearing on Market Circuit Breakers, Senate Committee on Banking, Housing and Urban Affairs, Subcommittee on Securities, January 29, 1998. Accessed October 18, 2026.