China's Official PMI for October: Factories 49.3, Services 50.0
Key Points
- China's National Bureau of Statistics put the October 2026 manufacturing PMI at 49.3 percent, down 0.8 points from September, and the non-manufacturing business activity index at 49.7 percent.
- Large manufacturers read 50.2 percent, above the 50 line, while medium-sized firms read 48.4 percent and small firms 47.5 percent.
- Services business activity was 50.0 percent and construction 48.0 percent.
- The manufacturing sample covers 3,200 firms in 31 industry groups, and the headline weights new orders at 30 percent.
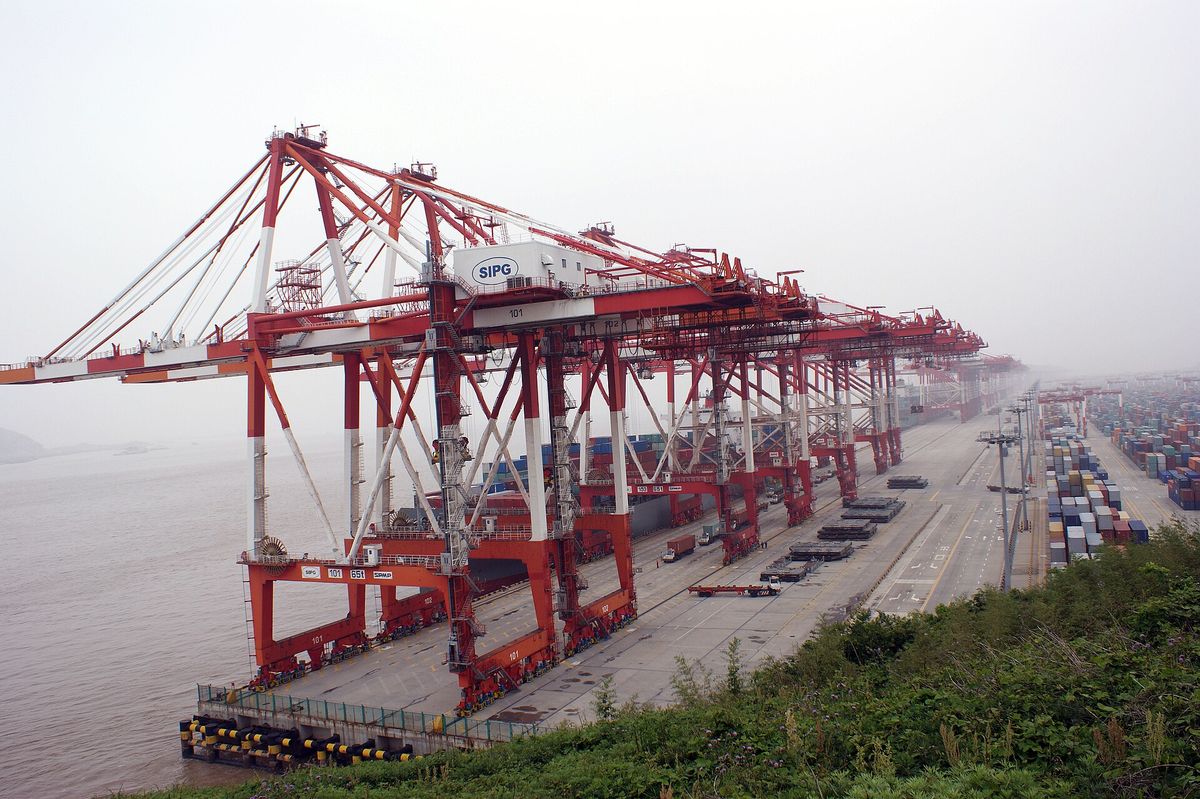

China's official purchasing managers' surveys for October 2026 showed manufacturing just under the line between growth and contraction and services right on it. The National Bureau of Statistics (NBS) published the results on Saturday, October 31, 2026, with a page timestamp of 09:30. It put the manufacturing PMI at 49.3 percent, down 0.8 percentage points from September1, and the non-manufacturing business activity index at 49.7 percent, down 0.5 points1. The figures are a monthly read of what company buyers and managers report.
Manufacturing: what moved
The NBS described the manufacturing reading as a pullback in business conditions1. Large companies stayed above the 50 line: the PMI for large enterprises was 50.2 percent, down 0.4 points1, while medium-sized firms read 48.4 percent and small firms 47.5 percent1, drops of 1.3 and 1.4 points. Of the five indices that make up the headline, only the supplier delivery times index was above 501, at 50.2 percent, up 0.1 points. The four below it were production at 49.8 percent, down 1.9 points1, new orders at 49.4 percent, down 1.1 points1, raw material inventory at 48.4 percent, up 0.2 points1 and employment at 48.4 percent, unchanged1.
The wider table in the release adds more. The new export orders index was 48.7 in October against 50.0 in September1, and the import index 47.0 against 49.21. The index for prices paid for main raw materials was 56.8, down from 60.81, and the index for ex-factory prices was 51.7, down from 54.01. Both are still above 50, though lower than in September. The production and business activity expectations index stood at 53.4, against 53.8 in September1, still above 50.
Services and construction
The non-manufacturing survey splits into two groups. Services business activity was 50.0 percent, down 0.2 points1, and construction was 48.0 percent, down 2.3 points1. Within services, the NBS said railway transport, water transport, postal services and internet software and IT services each had activity indices at or above 55 percent1, while capital market services, insurance and real estate were below 501. Looking ahead, the business activity expectations index was 54.7 percent, down 0.8 points but still above 501, which the NBS read as continued confidence among non-manufacturing firms. By group, expectations were 55.2 for services and 52.3 for construction1. New orders were weaker, with the non-manufacturing index at 44.4 percent, down 2.1 points1.
The composite output index, which combines manufacturing production and non-manufacturing activity, was 49.7 percent, down 1.0 point1. The NBS summarised it as a slowdown in overall business activity.
How the survey is built
A PMI is a diffusion index. For each question, the index is the percentage of firms answering that the measure rose, plus half the percentage answering that it was unchanged1. The NBS notes that a reading above 50 reflects expansion from the previous month and below 50 contraction. Because it compares each month with the one before, a reading of 49.3 does not say that output fell to a low level. It says that the weighted blend of the five answers sits below 50, which the NBS treats as the line between expansion and contraction compared with the previous month.
The manufacturing sample covers 31 manufacturing industry groups with 3,200 sampled firms1, and the non-manufacturing sample 43 industry groups with 4,300 firms1. The NBS says it draws the sample by probability proportional to size. Each industry group is a stratum, sample sizes are allocated by the group’s share of value added1, and within a group firms are chosen with a probability in proportion to their main business revenue1. The survey is run by the NBS survey teams through its direct-reporting network, and the release is credited to the NBS Service Industry Survey Center and the China Federation of Logistics and Purchasing.
The headline manufacturing PMI is a weighted blend of five indices: new orders at 30 percent, production at 25, employment at 20, supplier delivery times at 15 and raw material inventory at 101. The delivery times index is inverted when blended. As the editors' own arithmetic, not an NBS figure: using the October readings of 49.4, 49.8, 48.4, 50.2 and 48.4 with those weights, and reading the inversion as 100 minus the index, gives 49.26, which rounds to the published 49.3. The composite output index is weighted by the manufacturing and non-manufacturing shares of GDP1. The NBS also says all published indices are seasonally adjusted1, because the monthly survey swings with the calendar.
Reading it against the year
The release carries a table of the manufacturing PMI back to October 2025. Over the ten months of 2026 so far, the reading was above 50 in March (50.4), April (50.3), June (50.3) and September (50.1)1, exactly 50.0 in May, and below 50 in January (49.3), February (49.0), July (49.2), August (49.8) and October (49.3). A year earlier, in October 2025, the manufacturing PMI was 49.01, so this October's 49.3 is 0.3 points higher than that. The index of prices paid for raw materials reached 63.9 in March1, the highest in the table, and was 56.8 in October.
A note on the source. The release page is in Chinese, and the English wording in this article is the editors' own translation of it. Every published figure above comes from that one page; the weighted-average check is the editors' arithmetic.
Trivia
- What was China's official manufacturing PMI for October 2026? 49.3 percent, down 0.8 points from September1.
- Which of the five manufacturing PMI components was above 50 in October? Supplier delivery times, at 50.2 percent1.
- How many manufacturing firms does the NBS survey sample cover? 3,200 firms in 31 industry groups1.
- What weight does new orders carry in the headline manufacturing PMI? 30 percent, the largest of the five1.
- What was the services business activity index in October 2026? 50.0 percent, down 0.2 points1.