October 2026 CPI: Prices Up 0.4 Percent, With No Official Yearly Rate
Key Points
- Consumer prices rose 0.4 percent on a seasonally adjusted basis in October 2026, and the index excluding food and energy rose 0.3 percent, BLS reported on November 10.
- BLS published no 12-month change for most indexes because it did not collect survey data for October 2025 during a lapse in appropriations.
- Energy rose 0.7 percent after a 5.2 percent jump in September, and food rose 0.5 percent after being unchanged.
- The November 2026 CPI is scheduled for Thursday, December 10, 2026.
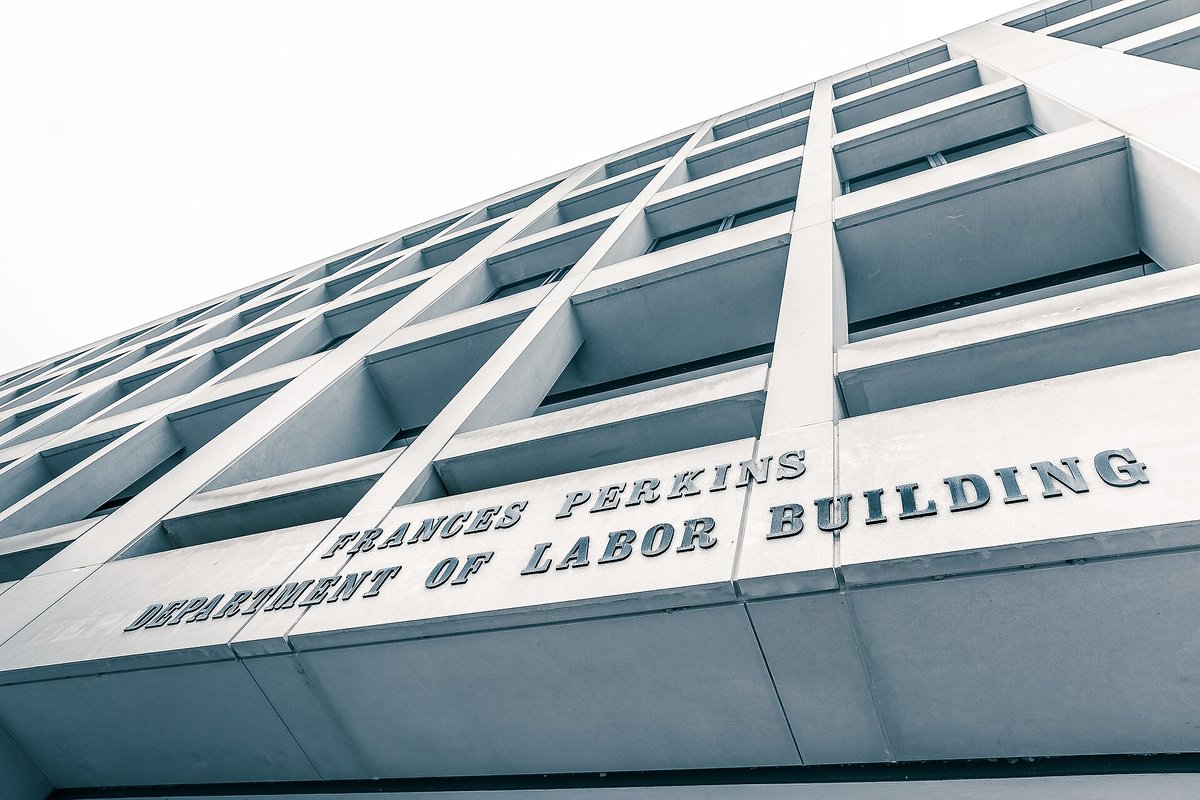

Consumer prices in the United States rose 0.4 percent on a seasonally adjusted basis in October 2026, the Bureau of Labor Statistics reported in its release of Tuesday, November 101. The bureau is an agency of the U.S. Department of Labor6. The release leaves out the change from a year earlier for most indexes, because BLS did not collect survey data for October 2025 during a lapse in appropriations1.
The October numbers
The headline index, the Consumer Price Index for All Urban Consumers (CPI-U), rose 0.4 percent in October after a 0.6 percent rise in September1. The index for all items less food and energy rose 0.3 percent, as it did in September and August1.
Food rose 0.5 percent after being unchanged in September. Food at home rose 0.4 percent and food away from home 0.5 percent1. Within groceries, fruits and vegetables and dairy each rose 0.6 percent, beef rose 0.9 percent and nonalcoholic beverages fell 0.3 percent1.
Energy rose 0.7 percent, a far smaller move than its 5.2 percent jump in September1. Gasoline rose 1.0 percent, electricity 0.9 percent and fuel oil 2.0 percent, while utility gas service fell 0.8 percent1. Before seasonal adjustment, gasoline prices fell 0.7 percent in October1. Seasonal adjustment removes the effect of seasonal influences, those that occur at the same time and in about the same size every year4, so an adjusted rise and an unadjusted fall can both be accurate for the same month.
Shelter rose 0.3 percent, with owners equivalent rent up 0.3 percent, rent up 0.2 percent and lodging away from home up 0.6 percent1. Shelter carries more weight than food and energy combined, a relative importance of 35.238 out of 100 as of September 2026, against 13.447 for food and 7.649 for energy2.
Outside food and energy, recreation rose 0.8 percent, motor vehicle insurance 0.7 percent, medical care 0.3 percent, education 0.3 percent and new vehicles 0.2 percent1. Used cars and trucks fell 1.2 percent and communication slipped 0.1 percent1.
Why there is no 12-month figure this time
The release states that BLS cannot publish 12-month percent changes for October 2026 for indexes where October 2025 data are unavailable1. In the release table, the column for the unadjusted change from October 2025 to October 2026 is blank for most rows, with a note that the October 2025 values are not available because of the 2025 lapse in appropriations2.
BLS keeps a fact sheet on approximating missing data points. It describes estimating a missing month with the geometric mean of the index values for the months immediately before and after it, for cases such as a contract where all parties agree to do so3. The fact sheet says such a result cannot be interpreted as an official CPI series, and that percent changes based on approximated data should be considered unofficial estimates3.
Three rows that do have a yearly change
Three lines in the release table do show an unadjusted change from October 2025 to October 2026: gasoline (all types) at 37.4 percent, new vehicles at 0.7 percent, and used cars and trucks at minus 3.3 percent2. Those are the rows for which the table prints an October 2025 index.
Where the index level stands
The CPI-U reached an index level of 337.511 in October on its 1982-84 base, up 0.2 percent before seasonal adjustment1. On that base the average price level for 1982 to 1984 equals 100, so an index of 110 would mean prices 10 percent above that period4. By that reading, the October level puts prices at about 3.4 times their 1982 to 1984 average.
Two other headline measures moved too. The index for urban wage earners and clerical workers (CPI-W) rose to 331.147, up 0.1 percent before seasonal adjustment, and the Chained Consumer Price Index for All Urban Consumers (C-CPI-U) rose 0.2 percent before seasonal adjustment1. The release notes that chained index values for the past 10 to 12 months are subject to revision1.
What the CPI measures, and what it does not
BLS describes the CPI as a measure of the average change over time in the prices paid by consumers for a representative basket of goods and services4. The CPI-U covers over 90 percent of the U.S. population, while the CPI-W represents approximately 30 percent4. The weights in the basket come from the Consumer Expenditure Surveys, whose interview and diary data show what households buy4.
BLS stops short of calling the CPI a full cost-of-living index. It says the CPI is sometimes termed a conditional cost-of-living index, because it does not measure every factor that affects living costs4. It describes the chained index as thought by some to be a closer approximation to a cost-of-living index, since it also allows for substitution across item categories4.
The numbers reach household budgets through other programs. The CPI-U and CPI-W are commonly used in escalation agreements, the CPI is used to adjust the federal income tax structure, and the Social Security cost-of-living adjustment is defined from the third quarter average of the CPI-W4.
What comes next
As of the October release, the November 2026 CPI is scheduled for Thursday, December 10, 2026, at 8:30 a.m. Eastern1. BLS also said that with the publication of January 2027 data on February 11, 2027, several index titles will change, including those for wireless telephone services, physicians' services, and music instruments and accessories1.
Trivia
- In what year did BLS begin publishing separate price indexes for 32 cities? 1919. Rapid price increases during World War I, particularly in shipbuilding centers, made a fuller index essential, and family spending was studied in 92 industrial centers from 1917 to 19195.
- When did regular publication of a national U.S. city average index begin? In 1921, with estimates carried back to 19135.
- In which year did BLS add the CPI for All Urban Consumers and rename the older index the CPI-W? 1978, in the fourth comprehensive revision5.
- When was the chained CPI for All Urban Consumers added? August 20025.
- When did the rental equivalence concept enter the CPI-U? January 1983, and January 1985 for the CPI-W5.
- In what year did BLS begin publishing its indexes to three decimal places? 20075.
- About how many items does BLS record prices for each month? About 80,0004.
Sources
- Bureau of Labor Statistics, Consumer Price Index, October 2026, news release USDL-26-1685, November 10, 2026. Accessed November 12, 2026.
- Bureau of Labor Statistics, Consumer Price Index, October 2026, Table 1: CPI-U, US city average, by expenditure category. Accessed November 12, 2026.
- Bureau of Labor Statistics, Approximating missing data points, Consumer Price Index fact sheet, last modified December 17, 2025. Accessed November 12, 2026.
- Bureau of Labor Statistics, Consumer Price Index Frequently Asked Questions. Accessed November 12, 2026.
- Bureau of Labor Statistics, Handbook of Methods, Consumer Price Index: History. Accessed November 12, 2026.
- Bureau of Labor Statistics, About BLS. Accessed November 12, 2026.