Euro Area Industrial Output Rises 0.2% in September After Three Falls
Key Points
- Eurostat reported on 16 November 2026 that euro area industrial production rose 0.2% in September 2026 from August, and EU production rose 0.5%.
- Euro area production had fallen 0.2% in June, 0.3% in July and 0.5% in August before the September rise.
- Compared with September 2025, production was 1.5% lower in the euro area and 0.8% lower in the EU.
- The Netherlands had the highest annual increase among reporting member states at 8.8%, while Ireland had the largest fall at 19.1%.
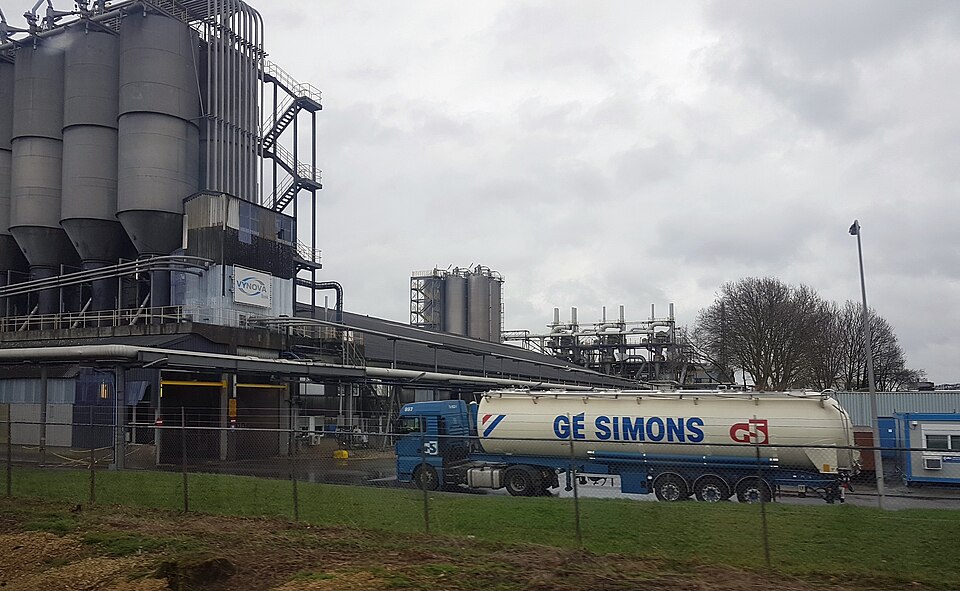

Factories and other industrial producers in the euro area made a little more in September 2026 than in August. In a release dated Monday, 16 November 2026, Eurostat said that seasonally adjusted industrial production increased by 0.2% in the euro area and by 0.5% in the EU1 compared with August 2026. It was the first monthly rise in the euro area since May, after three monthly falls.
The headline numbers
The release covers September 2026 against the month before and against September 2025. In August 2026, industrial production had fallen by 0.5% in the euro area and by 0.3% in the EU1, and Eurostat notes that both monthly figures were unchanged from the release of 15 October 2026. Over the year, industrial production in September 2026 was 1.5% lower than in September 2025 in the euro area and 0.8% lower in the EU1.
The monthly series in the release's table runs from April 2026: 0.1% in April, 0.2% in May, then falls of 0.2% in June, 0.3% in July and 0.5% in August, before the 0.2% rise in September1. The euro area index, with 2021 equal to 100, stood at 97.5 in September 2026, up from 97.3 in August1.
What moved inside the total
Eurostat splits industry into main groupings. Compared with August, euro area production rose for intermediate goods by 0.7% and for durable consumer goods by 1.3%, fell for energy by 1.7% and for non-durable consumer goods by 0.4%, and stayed stable for capital goods1.
Against September 2025 the picture differs by group. In the euro area, production rose for intermediate goods by 0.4%, for energy by 0.7%, for capital goods by 0.3% and for durable consumer goods by 1.6%, and fell for non-durable consumer goods by 7.5%1. The 7.5% drop in non-durable consumer goods is the largest annual move among the main groupings in the euro area table, and the release shows monthly falls of 2.8% in both July and August for that group before a 0.4% fall in September.
Country by country
Eurostat only ranks the member states for which data are available. For the month, the highest increases were in Denmark (3.7%), Poland (2.9%), and Czechia and Slovakia (both 2.7%), and the largest decreases were in Ireland (5.5%), Luxembourg (3.8%) and Romania (2.6%)1. Germany is listed with a 1.3% monthly rise1 in the country table, and France with a 0.5% fall.
Over the year, the highest annual increases were in the Netherlands (8.8%), Hungary (8.2%), and Lithuania and Malta (both 7.1%)1. The largest annual decreases were in Ireland (19.1%), Bulgaria (8.9%) and Romania (6.3%). Ireland's index in the seasonally adjusted table fell from 107.3 in August 2026 to 101.4 in September1. Belgium and Switzerland had no September figure in this release.
How the measure works
The index of industrial production measures the evolution of the volume of production for industry excluding construction, based on data adjusted for calendar and seasonal effects1. Total industry covers NACE Rev. 2 sections B to D1. It tracks the volume of production.
The euro area figure here is for the EA21, which includes Belgium, Bulgaria, Germany, Estonia, Ireland, Greece, Spain, France, Croatia, Italy, Cyprus, Latvia, Lithuania, Luxembourg, Malta, the Netherlands, Austria, Portugal, Slovenia, Slovakia and Finland1. Eurostat estimates missing observations from member states for recent months when it builds the euro area and EU totals. First estimates are revised: the release notes that the EU annual figure for August was revised from a 0.2% fall to a 0.1% fall compared with the 15 October release.
Trivia
- By how much did euro area industrial production rise in September 2026 compared with August? 0.2%1, with the EU up 0.5%.
- What base year is the production index set to 100 in? 20211.
- Which member state had the highest annual increase in industrial production in September 2026? The Netherlands, at 8.8%1.
- Which main grouping fell by 1.7% in the euro area from August to September 2026? Energy1.
- Does the industrial production index include construction? No, it covers industry excluding construction1.
Sources
- Industrial production up by 0.2% in the euro area and by 0.5% in the EU, Euro indicators, Eurostat, 16 November 2026. Accessed November 17, 2026.