Halloween Spending 2026: NRF Forecasts $13.5 Billion, Plus Trivia
Key Points
- The National Retail Federation forecast $13.5 billion in Halloween spending for 2026, or $115.14 per person, up from a record $13.1 billion in 2025.
- Costumes lead at $4.4 billion, followed by decorations at $4.3 billion and candy at $4.1 billion.
- About 74% of consumers plan to celebrate, and 4.6 million children plan to dress as Spider-Man.
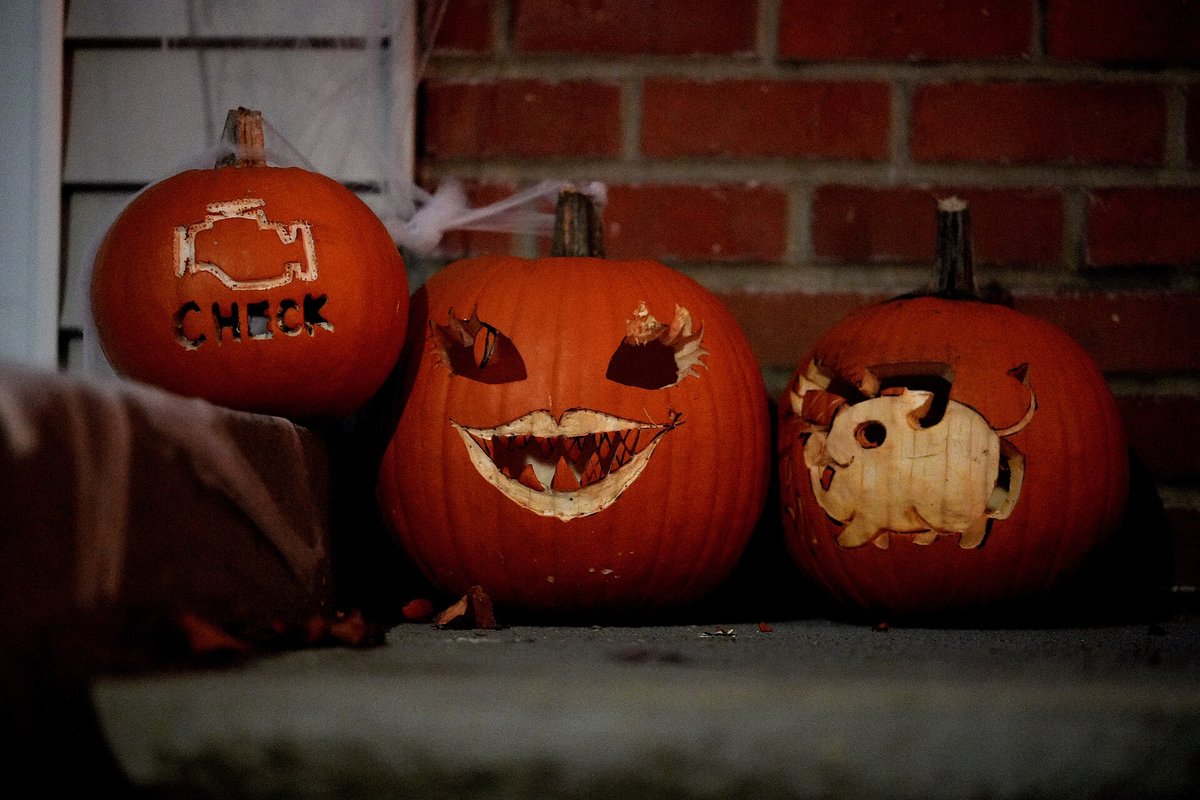

Americans are expected to spend $13.5 billion on Halloween1 in 2026, the National Retail Federation said on September 22, 2026, edging past last year’s record $13.1 billion1. NRF and Prosper Insights & Analytics surveyed 7,889 consumers1 from September 1 to 9, with a margin of error of plus or minus 1.1 percentage points.
Where the money goes
Costumes lead the bill at $4.4 billion1, with decorations close behind at $4.3 billion and candy at $4.1 billion. Greeting cards add $0.8 billion1. Candy is still the thing almost everyone buys, with 96% of consumers planning to buy sweets1, against 78% for decorations and 71% for costumes.
Cards are more popular in 2026, NRF says, with planned purchases rising to 42% from 38% in 20251. Per person, the forecast is $115.141, close to the record $114.45 of 20252.
Who is celebrating
About 74% of consumers1 plan to celebrate in 2026, against 73% last year. That level has held since the pandemic years and sits above 2019, when only 68%1 planned to take part. The favorite activities are handing out candy (61%), dressing in costume (50%), and a three-way tie at 42% for decorating, carving pumpkins and watching scary movies1.
“Consumers continue to make Halloween a spending priority, but they are also approaching the season with affordability in mind,”1 said Allison Zeller, NRF’s vice president of industry and consumer insights.
How people plan to shop
Shopping starts far earlier than it did a decade ago. About 49% planned to start in September or earlier1, up from 34% in 2016. Among those early birds, 42% say they look forward to fall, and 23% shop early to spread out their budgets1.
If prices run high, 34% plan to look for items they can reuse or repurpose, 31% will comparison shop and 26% will hunt for coupons or sales1.
Discount stores are the top stop at 39%1, followed by specialty Halloween and costume stores (32%) and online (27%). Local and small businesses drew 13% of shoppers, almost double 7% a decade ago1. The survey also found 47% of consumers are using AI tools1 for their Halloween shopping, most often to brainstorm ideas (34%).
The costume rankings
Children’s costumes should account for $1.5 billion1. Spider-Man is the runaway pick, with 4.6 million children1 planning to wear the suit. That is double the 2.3 million2 in NRF’s 2025 survey. A superhero (2.3 million), a princess (2.2 million), a witch and a ghost (1.6 million each) round out the top five.
Adults are expected to spend $2 billion1 on their own costumes. The witch stays on top at 4.8 million1, down from 5.6 million in 20252, while the vampire rises to 4.2 million from 2.7 million2. Batman, Spider-Man and a ghost follow.
Pets get their own budget, about $0.92 billion1. The favorite pet costume is a pumpkin (11.6%), then a hot dog (5.9%) and a ghost (2.8%)1.
A few years of NRF forecasts
NRF has run its Halloween survey since 20051, and the totals have mostly climbed through the 2020s. The forecast was a record $10.6 billion in 20225, topping $10.1 billion the year before. It jumped to a record $12.2 billion in 20234, then slipped to $11.6 billion in 20243 before the $13.1 billion of 20252.
Candy shows the same climb. NRF projected $3.6 billion in 2023, up from $3.1 billion4 in 2022, then $3.5 billion in 20243 and $3.9 billion in 20252, before the $4.1 billion forecast for 2026. Spending per person set what was then a record of $108.24 in 20234. The 2026 figure is about $7 higher.
The pumpkins behind it all
USDA’s Economic Research Service says U.S. growers produced 1.47 billion pounds of pumpkins in 20257, up about 4% from 2024. Illinois alone grew about 533 million pounds7, slightly more than the next four states combined.
Many Illinois pumpkins never see a porch, though. In the 2022 Census of Agriculture, nearly 70% of the state’s pumpkin acreage went to processing7 for products like pie filling, while nationally about 85 percent of pumpkin acreage7 served the fresh and ornamental market. The whole U.S. crop was worth $259 million in 20257.
How trick-or-treating got here
The Census Bureau notes that some trace Halloween to the festival of Samhain6 among the Celts of ancient Britain and Ireland, and that Irish and other immigrants brought their customs to the United States beginning in the mid-19th century6. In Scotland and Ireland, children went guising8, going door to door in disguise and performing for food or coins.
The phrase itself is younger. Its earliest known use was “tricks or treats,” in a 1917 report8 from Sault Ste. Marie, Ontario. The phrase spread into the northern and western United States in the 1930s and across the rest of the country through the 1940s and early 1950s. Trick-or-treating itself was stalled by World War II sugar rationing8, which lasted until June 1947.
The Census Bureau estimates 72.0 million children under 186 as of July 1, 2025, and estimates 132.7 million occupied housing units6 in 2024, each one a potential stop.
Trivia
- Who is credited with inventing candy corn in Philadelphia in the late 1880s? George Renninger10, of the Wunderle Candy Company.
- Which day does the National Confectioners Association call National Candy Corn Day? October 3010.
- What were jack-o’-lanterns carved from in 19th century Britain and Ireland? Turnips or mangel wurzels9, hollowed out and often carved with grotesque faces.
- In what year did UNICEF start its Trick-or-Treat for UNICEF program? 19508. Participants collect money for the organization, usually instead of candy.
- Which 1952 Walt Disney cartoon showed trick-or-treating? Trick or Treat8, by which time the custom was firmly established in popular culture.
- Among the five top pumpkin states, which got the highest grower price in 2025? Pennsylvania7, at about $269 per 1,000 pounds.
- How many occupied U.S. housing units had steps for trick-or-treaters to climb in 2023? 56.6 million6.
Sources
- National Retail Federation, NRF Halloween Survey Shows Consumer Spending Expected to Reach $13.5 Billion, press release, September 22, 2026. Accessed October 21, 2026.
- National Retail Federation, NRF Consumer Survey Finds Halloween Spending to Reach Record $13.1 Billion, press release, September 18, 2025. Accessed October 21, 2026.
- National Retail Federation, Nearly Half of Halloween Shoppers to Start Purchasing Items Before October, press release, September 19, 2024. Accessed October 21, 2026.
- National Retail Federation, Halloween Spending to Reach Record $12.2 Billion as Participation Exceeds Pre-Pandemic Levels, press release, September 20, 2023. Accessed October 21, 2026.
- National Retail Federation, Halloween participation returns to pre-pandemic levels with record spending, press release, September 19, 2022. Accessed October 21, 2026.
- U.S. Census Bureau, Halloween: October 31, 2026, Facts for Features CB26-FF.08, October 8, 2026. Accessed October 21, 2026.
- USDA Economic Research Service, Pumpkins: Background and Statistics, updated September 29, 2026. Accessed October 21, 2026.
- Trick-or-treating, Wikipedia. Accessed October 21, 2026.
- Jack-o’-lantern, Wikipedia. Accessed October 21, 2026.
- Candy corn, Wikipedia. Accessed October 21, 2026.