What Did the Hawthorne Lighting Experiments Really Find?
Key Points
- The Hawthorne effect is named after experiments at a Western Electric plant in Cicero, Illinois, the first of which were lighting experiments that began in 1924.
- A 2009 working paper by Levitt and List recovered the original data and called the commonly told pattern, that every lighting change raised output, entirely fictional, while noting subtler hints of an effect.
- A 2014 systematic review of 19 evaluations concluded that research participation effects do exist but that little can be securely known about their size or conditions.
- A 2007 randomized trial of 176 participants found a difference in a cognitive score favoring intensive follow-up and a difference in participant-rated quality of life favoring minimal follow-up.

The Hawthorne effect is the idea that people change their behavior when they know they are being observed. It is named after a Western Electric factory near Chicago, and it is a widely used research term. The usual story of where it came from is simpler than the record. This article follows three papers: a re-analysis of the original lighting data, a systematic review of later evidence, and a randomized trial that tested the idea directly.
The lighting experiments
Levitt and List describe the starting point this way: in 1924 the National Research Council began experiments at Western Electric’s Hawthorne Plant in Cicero, Illinois, to answer a narrow question, whether better lighting raises worker productivity1. The workers in the three departments involved were women who mostly assembled relays and wound coils of wire, and their output was counted as units completed per unit of time1.
The abstract says both academics and popular writers commonly summarize the results as showing that every change in light, even a change that made the room dimmer, increased productivity1. Their paper quotes one such summary: each time a change was made, productivity rose, and when the experimenters went back to poor lighting, productivity kept rising1.
The data nobody had analyzed
According to the paper, the data from the illumination experiments had never been formally analyzed and were thought to have been destroyed1. The authors traced them to a microfiche room in a small library in Milwaukee and to a second archive in Boston, then extracted the numbers from graphs into spreadsheets1.
The paper is a National Bureau of Economic Research working paper dated May 2009, and its cover says such papers have not been peer reviewed1. A journal version appeared in American Economic Journal: Applied Economics in January 2011, and its abstract again says that existing descriptions of supposedly remarkable data patterns prove to be entirely fictional while the authors find more subtle manifestations of possible Hawthorne effects2.
What the numbers showed
The abstract states that the authors find the existing descriptions of supposedly remarkable data patterns to be entirely fictional, and that there are hints of more subtle manifestations of a Hawthorne effect in the original data1. The details in the body of the paper explain both halves of that sentence.
In the first year, output in all three rooms rose to a peak roughly 10 percent above the baseline before the experiment, then declined but stayed above baseline when experimentation paused in April1. By the authors’ estimate from company reports, output per worker for the whole plant rose 1.4 percent per year over the period1. Taken alone, the paper says, that first year seems to fit the popular story.
Later years complicate it. Room 1 saw output peak about 20 percent above its baseline while lighting was varied, but room 2 and, to a lesser extent, room 3 also saw substantial increases even though those workers were no longer part of the experiment1. When experimentation in room 1 was paused for the second time, output fell in all three rooms, as it had the previous summer, which the authors read as a seasonal pattern rather than a reaction to the experiments stopping1.
The authors also checked the claim that output jumped right after a lighting change. All changes were made on Mondays, and output rose on those Mondays, but an identical pattern appeared on Mondays on which the lighting was left alone, so the paper attributes it to the weekly cycle (Saturday output was very low and Monday output was lower than on other weekdays)1. After controlling for other factors, the immediate response to a lighting change was statistically insignificant and close to zero1.
One of their specifications did find output 3 to 4 percent higher while experimentation was ongoing than in the baseline period, even after controls, and the paper calls that supportive of a Hawthorne effect1, while noting that output in the first room could have been rising for other reasons. The authors conclude that the evidence in the experiments that gave the phenomenon its name is far more subtle than has been previously acknowledged, and that its presence and magnitude depend on features of the environment1.
A review of later evidence
McCambridge, Witton and Elbourne published a systematic review in the Journal of Clinical Epidemiology in March 2014 (volume 67, issue 3), asking whether the Hawthorne effect exists, under what conditions, and how large it is3. The review included 19 purposively designed evaluations: eight randomized controlled trials, five quasi-experimental evaluations and six observational ones3. Its introduction notes that the term was first used in an influential methodology textbook in 19533.
The abstract reports that methods, contexts and findings were highly heterogeneous, that most of the evaluations reported some evidence of an effect, and that significant biases were judged likely3. Its conclusion is that consequences of research participation for the behaviors being investigated do exist, but little can be securely known about the conditions, mechanisms or magnitudes, so new concepts are needed3.
A trial built to test it
McCarney and colleagues reported a randomized trial in BMC Medical Research Methodology in July 2007 (volume 7) that nested the question inside a placebo-controlled trial of Ginkgo biloba for mild to moderate dementia4. The 176 participants were randomized to intensive follow-up, with comprehensive assessment visits at baseline and at two, four and six months, or to minimal follow-up, with an abbreviated baseline assessment and a full one at six months4.
At six months, the follow-up group had a significant effect on the cognitive score (ADAS-Cog), with a mean difference of -2.018 (95% confidence interval -3.914 to -0.121, p = 0.037) favoring intensive follow-up4. On participant-rated quality of life the difference was -1.382 (95% confidence interval -2.642 to -0.122, p = 0.032), favoring minimal follow-up, and there was no significant difference on carer-rated quality of life4. The two main outcomes pointed in different directions, as the abstract reports.
Where the evidence stands
Put side by side, the three papers answer different questions. The re-analysis finds that the famous claim about the lighting data, that any change at all raised output, does not match the numbers it recovered, while reporting subtler patterns it calls consistent with some effect. The review finds that research participation can change behavior but that the evidence is too varied to say how much or why. The trial found a measurable difference on one outcome and an opposite one on another.
None of the three papers’ abstracts says that being observed never changes behavior, and this article does not claim that. What the record supports is narrower: the classic lighting story is not what the recovered data show, and the broader idea has mixed support. This article draws no advice from any of these papers.
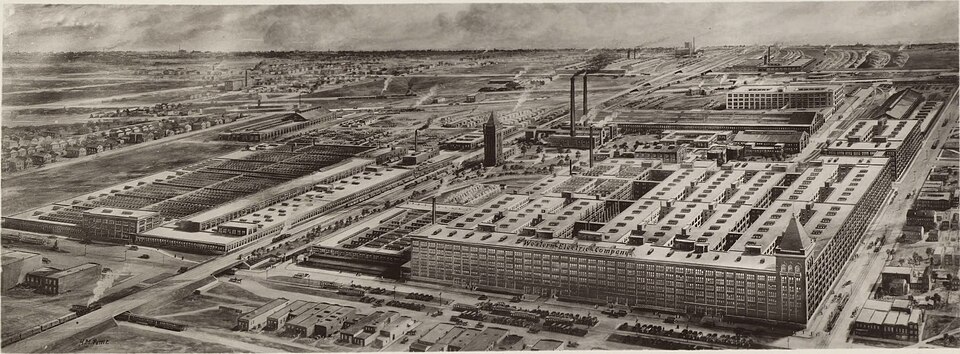
The image at the top is titled "Hawthorne, Illinois Works of the Western Electric Company, 1925" and comes from a Western Electric photograph album, filed on Wikimedia Commons. It dates from the years of the lighting experiments and does not depict any worker, room or measurement from the papers above.
Trivia
- In which Illinois city was the Hawthorne Plant that hosted the lighting experiments? Cicero1.
- In what year did the lighting experiments begin? 1924, started by the National Research Council1.
- On which day of the week were all lighting changes made? Monday1.
- How many evaluations did the 2014 systematic review include? 19, of which eight were randomized controlled trials3.
- How many participants were randomized in the 2007 trial of intensive versus minimal follow-up? 1764.
Sources
- Levitt SD, List JA. Was there Really a Hawthorne Effect at the Hawthorne Plant? An Analysis of the Original Illumination Experiments. NBER Working Paper 15016, May 2009. Accessed November 4, 2026.
- Levitt SD, List JA. Was There Really a Hawthorne Effect at the Hawthorne Plant? An Analysis of the Original Illumination Experiments. American Economic Journal: Applied Economics, 3(1), 224-238, January 2011. Accessed November 6, 2026.
- McCambridge J, Witton J, Elbourne DR. Systematic review of the Hawthorne effect: new concepts are needed to study research participation effects. Journal of Clinical Epidemiology, 67(3), 267-277, March 2014. Accessed November 4, 2026.
- McCarney R, Warner J, Iliffe S, van Haselen R, Griffin M, Fisher P. The Hawthorne Effect: a randomised, controlled trial. BMC Medical Research Methodology, 7, July 2007. Accessed November 4, 2026.