Chips Lift Japan's Exports in September, but Imports Grow Faster
Key Points
- Japan's exports rose 16.7 percent in September 2026 from a year earlier and imports rose 18.9 percent, for a trade deficit of about 537 billion yen.
- Exports of the group the ministry labels semiconductors etc. rose 49.4 percent from a year earlier, and exports of semiconductor machinery etc. rose 43.9 percent.
- Petroleum imports rose 51.1 percent in value on 3.1 percent more volume, and mineral fuel imports rose 39.4 percent.
- The United States was Japan's largest single-country export market for the month, with shipments up 22.9 percent.

Japan's exports grew 16.7 percent in September 2026 from a year earlier, but its imports grew faster, up 18.9 percent, and the country ran a trade deficit for the month. The Ministry of Finance's provisional figures, released on October 21, 2026, put exports at 10,972,254 million yen and imports at 11,508,812 million yen1, about 10.97 trillion and 11.51 trillion yen. That left a deficit of about 537 billion yen, against a deficit of 277,703 million yen1, about 278 billion yen, in September 2025.
Chip exports rose by half
In the ministry's commodity table, exports of the group it labels semiconductors etc. rose 49.4 percent, to about 933.7 billion yen1, and exports of the group it labels semiconductor machinery etc. rose 43.9 percent, to about 553.3 billion yen. Car exports rose 16.5 percent in value, to about 1.54 trillion yen1, although the number of cars shipped, 446,125, was up just 0.2 percent.
The ministry also prints a contribution degree, which it defines as the yen change of a category as a percentage of the grand total for the same term a year earlier. On that measure, semiconductors etc. contributed 3.3 points of the 16.7 percent rise in exports, cars 2.3 points and semiconductor machinery 1.8 points1. Within the semiconductors group, integrated circuits rose 55.5 percent in value, to about 734.4 billion yen, on 14.1 percent more units1. The broader electrical machinery category, which holds that group, made up 19.6 percent of exports and grew 30.3 percent1, the fastest of the main export categories apart from mineral fuels, which grew 52.0 percent from a small base. Transport equipment, the largest category at 20.8 percent of exports, grew 10.8 percent1.
The United States was Japan's largest single-country market for the month. Shipments there rose 22.9 percent, to about 1.96 trillion yen1, ahead of China at about 1.73 trillion yen, up 8.6 percent. Exports to Taiwan rose 37.8 percent and exports to South Korea 35.5 percent1.
Fuel imports cost more
Imports of mineral fuels rose 39.4 percent, to about 2.35 trillion yen1. Petroleum shows how far value can run ahead of volume. Japan bought 3.1 percent more of it by volume than a year earlier, but paid 51.1 percent more, about 1.11 trillion yen1. Liquefied natural gas imports fell 7.3 percent by volume while their value rose 39.2 percent1, to about 590.6 billion yen.
Fuel was the largest single driver on the import side. Mineral fuels made up 20.4 percent of imports and contributed 6.93 points of the 18.9 percent rise, with petroleum alone contributing 3.9 points1. Coal followed the same pattern, with imports up 26.9 percent in value, to about 336.7 billion yen, on 1.0 percent less volume1. Fuel also moved on the export side, though from a small base: exports of mineral fuels rose 52.0 percent, to about 197.5 billion yen, or 1.8 percent of all exports1.
Chip trade grew in both directions. Imports of the same semiconductors etc. group rose 51.4 percent, and imports of computers and units rose 42.0 percent1, although the number of computers and units imported was down 29.5 percent1, so the value rose while the number of units fell.
Where the balance sat
The ministry's area table splits the deficit by region. In trade with Asia, exports rose 17.5 percent to about 6.07 trillion yen and imports rose 22.2 percent to about 6.03 trillion yen, leaving a surplus of about 47 billion yen1. China was the largest deficit partner: imports from China rose 16.4 percent, to about 2.76 trillion yen, against exports of about 1.73 trillion yen, a gap of about 1.03 trillion yen1.
The United States ran a surplus. Exports to the United States rose 22.9 percent while imports from it rose 44.8 percent, to about 1.57 trillion yen, leaving a surplus of about 393 billion yen1. The Middle East showed a deficit of about 458 billion yen, with exports down 12.0 percent and imports down 7.0 percent1. In Western Europe, exports rose 12.5 percent and imports fell 2.4 percent1.
How to read the figures
These are provisional figures, and the ministry notes they are not seasonally adjusted1. Each percent change compares a figure with the same month a year earlier. The ministry values exports as they leave Japan (free on board) and imports with insurance and freight included (cost, insurance and freight)1, so the cost of getting goods to Japan is counted in the import figure. The balance column is exports minus imports, and a deficit is printed with a minus sign. The ministry prints a 93.2 percent change on the balance, which compares the September 2026 deficit with the September 2025 deficit1.
What to know
The ministry dates exports by the month a ship or aircraft carrying the goods leaves a Japanese port, and imports by the month of the import permit1, so one shipment can fall into different months on the two sides of a trade. Because the figures are not seasonally adjusted, the ministry's comparison with the same month a year earlier is the like-for-like one.
Trivia
- Which single country was Japan's largest export market in September 2026? The United States, at about 1.96 trillion yen1.
- Japan bought 3.1 percent more petroleum than a year earlier. How much more did it pay? 51.1 percent more1.
- Which exports grew faster by value, chips or cars? Semiconductors etc., up 49.4 percent, against 16.5 percent for cars1.
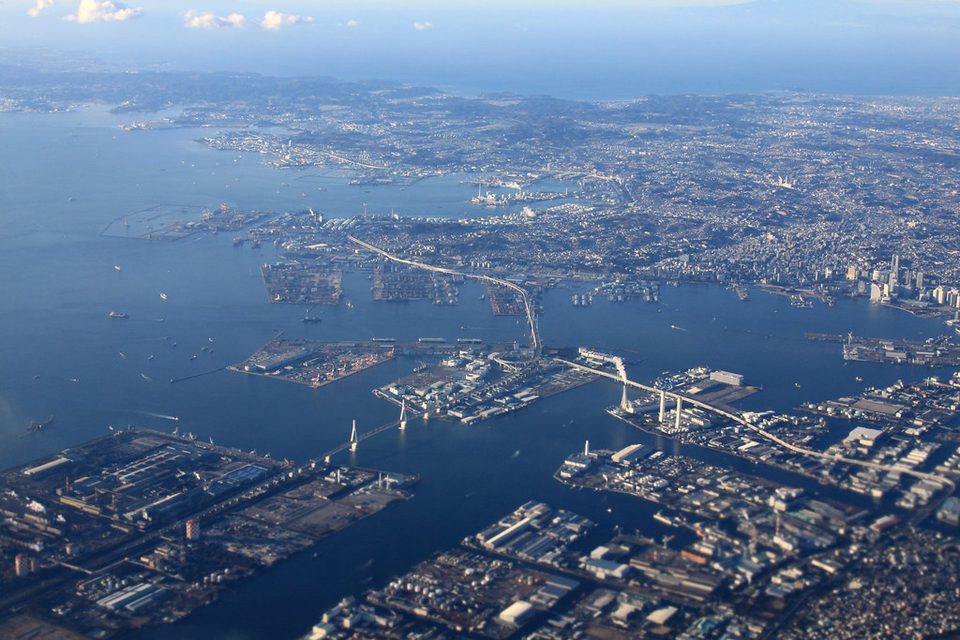
- Which treaty led to the Port of Yokohama opening to foreign trade in 1859? The Treaty of Amity and Commerce of 18582, which specified Kanagawa as an open port.
- What was Yokohama a center for exporting in the Meiji and Taisho periods? Raw silk2.
Sources
- Ministry of Finance, Japan, Trade Statistics, Value of Exports and Imports September 2026 (Provisional), October 21, 2026. Accessed October 31, 2026.
- Port of Yokohama, Wikipedia. Accessed October 21, 2026.