Mortgage Rates Dip to 7.32% From Their Highest Level Since 2023
Key Points
- Freddie Mac said on October 22, 2026, that the average 30-year fixed mortgage rate was 7.32%, down from 7.40% a week earlier and up from 6.19% a year earlier.
- The 7.40% readings on October 8 and 15 were the survey's highest since November 2023.
- The weekly survey averages rates offered on home purchase loans from the previous Thursday through Wednesday.
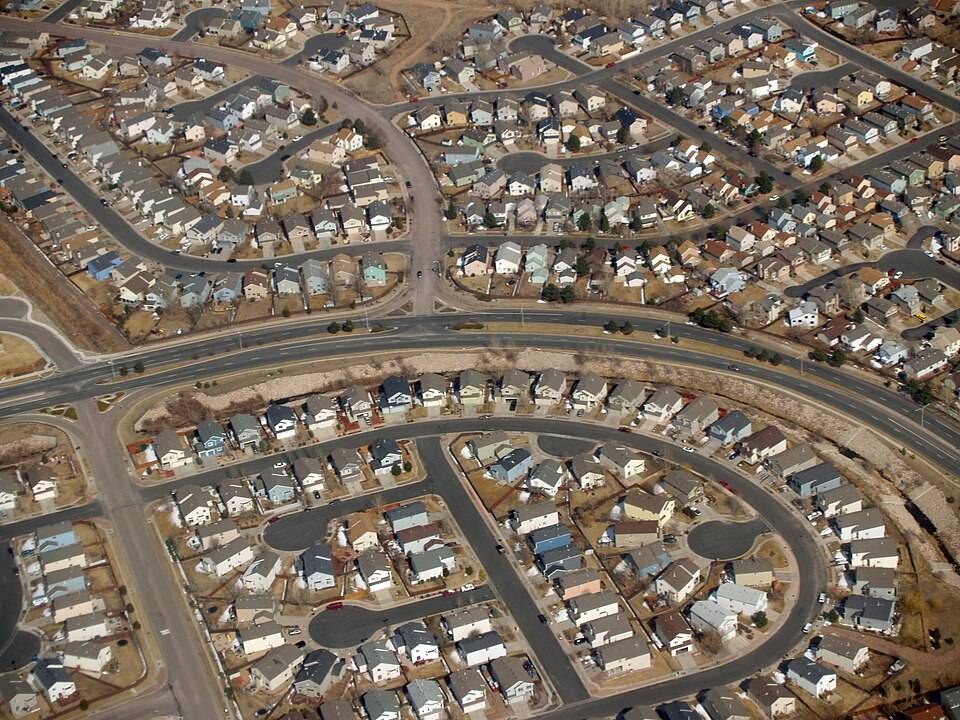

The average rate on a 30-year fixed mortgage in the United States dipped in the survey Freddie Mac released on October 22, 2026, after two weeks at its highest level since 2023. Freddie Mac said on Thursday, October 22, that the 30-year fixed-rate mortgage averaged 7.32%, down from 7.40% the week before and up from 6.19% a year earlier, and the 15-year fixed rate averaged 6.68%, down from 6.71%2.
The last five weeks
| Released | 30-year fixed rate |
|---|---|
| September 24 | 7.03% |
| October 1 | 7.28% |
| October 8 | 7.40% |
| October 15 | 7.40% |
| October 22 | 7.32% |
The figures come from Freddie Mac's historical weekly survey data2. The 7.40% readings on October 8 and October 15 were the highest since November 16, 2023, when the rate was 7.44%. The lowest reading of 2026 through October 22 was 5.98%, on February 26.
How to read the weekly moves
Rates in the table rose for two weeks, held for one and then eased. From September 24 to October 1 the average climbed 0.25 percentage points, from 7.03% to 7.28%, and the next week added another 0.12 points to reach 7.40%. It held at 7.40% on October 15 and then slipped 0.08 points to 7.32%. Across the five readings the net change is an increase of 0.29 points. These differences are Big Time Trivia's arithmetic on the published figures. A move of a few hundredths of a point in one week is small next to the 1.13 points separating 7.32% from the 6.19% average a year earlier.
The 15-year fixed rate comes from the same survey. In the October 22 release it averaged 6.68%, 0.64 points under the 30-year figure, and it was 5.44% a year earlier2.
What the survey measures
Freddie Mac publishes the Primary Mortgage Market Survey every Thursday at noon Eastern time (on Wednesday when Thursday is a U.S. holiday), as an average of loan rates offered from the previous Thursday through Wednesday1. It is built from mortgage applications lenders submit to Freddie Mac for home purchase loans1, and Freddie Mac describes the survey's borrower profile as good or excellent credit and a 20% down payment1. Because it is an average, the rate a given borrower is offered can differ.
Freddie Mac says the survey draws on weekly conventional, single-family originations with conforming loan limits as set by the Federal Housing Finance Agency1, and that it reflects applications submitted to Freddie Mac for the given week rather than settled loans1. The lenders behind those applications are a mix of credit unions, commercial banks and mortgage lending companies1. The week of application activity starts at 12:00 a.m. Eastern time on the prior Thursday and ends at 11:59 p.m. on Wednesday1, so the figure published on October 22 is not a snapshot of one day.
How the survey has changed
The survey is old enough to have been rebuilt. Freddie Mac has shared the average 30-year fixed rate since April 1971, added a 15-year fixed rate in 1991, and on November 17, 2022, stopped surveying lenders and began using data from its Loan Product Advisor system1. Adjustable rates and fees and points were discontinued in November 20221. Freddie Mac's FAQ explains the changes this way: adjustable-rate mortgages indexed to alternatives to U.S. Treasury securities have become more prevalent and the market has been dominated by fixed-rate products1, and fees and points are not always required to be provided by lenders under the current Loan Product Advisor requirements1. The weekly figure therefore describes the rate alone, not the full cost of getting a loan.
Who Freddie Mac is
The company behind the survey is a government-sponsored enterprise. Congress created it in 1970 to expand the secondary market for mortgages, and it buys mortgages, pools them and sells them as mortgage-backed securities to private investors3. On September 7, 2008, the Federal Housing Finance Agency placed Freddie Mac and its sister organization Fannie Mae under conservatorship3.
What the rate means for a payment
As an illustration, a $400,000 30-year fixed loan at 7.32% works out to about $2,748 a month in principal and interest, against about $2,447 at 6.19%, the average a year earlier. These figures are Big Time Trivia's calculation with the standard fixed-rate loan formula, and leave out property taxes, insurance and fees.
The same calculation puts the monthly principal and interest on a 15-year loan of $400,000 at 6.68% at about $3,524. The payment is higher because the balance is repaid in half the time, but the total interest is lower: about $234,000 over 15 years, against about $589,000 over 30 years at 7.32%. At 6.19% over 30 years the interest total is about $481,000. All of these are Big Time Trivia's arithmetic, not Freddie Mac's, and they assume the rate never changes.
That assumption holds for the loans in the survey. In a fixed-rate mortgage the interest rate stays fixed for the life of the loan, and under a standard annuity repayment scheme the periodic payment stays the same4. Mortgages in the United States are typically scheduled to amortize over 30 years4. A rate that moves from week to week changes the payment on a loan not yet taken out, not on one already closed.
What to know
The survey is a national average, and the interest rate on a mortgage is supposed to reflect the lender's risk4. A borrower with a smaller down payment or a weaker credit history than the survey's profile can be offered a different rate, and so can one whose loan is above the conforming limit. Freddie Mac itself notes that the survey covers purchase loans on owner-occupied, one-unit single-family properties1.
The Freddie Mac page this article cites updates every Thursday. A later release, dated October 29, 2026, put the 30-year rate at 7.24%, down from 7.32% the week before1. The figures above are left as Freddie Mac published them on October 22.
Trivia
- What was the 30-year rate in Freddie Mac's very first survey, on April 2, 1971? 7.33%, a hundredth of a point above the October 22, 2026, average of 7.32%2.
- What is the highest weekly average in the survey's history? 18.63%, on October 9, 19812.
- And the lowest? 2.65%, on January 7, 20212.
- Which 1970 law created Freddie Mac? The Emergency Home Finance Act of 19703.
- Where is Freddie Mac headquartered? McLean, Virginia3.
Rates are as Freddie Mac published them on October 22, 2026.
Sources
- Freddie Mac, Primary Mortgage Market Survey (Mortgage Rates), October 22, 2026. Accessed October 31, 2026.
- Freddie Mac, Primary Mortgage Market Survey historical weekly data (xlsx). Accessed October 23, 2026.
- Freddie Mac, Wikipedia. Accessed October 31, 2026.
- Mortgage loan, Wikipedia. Accessed October 31, 2026.